The January 2010 issue of
Technical Analysis of Stocks & Commodities carried an article describing a new indicator for gauging major changes in market direction,
The Vortex Indicator. It is a refinement of
J. Welles Wilder's Direction Movement Index, introduced in his classic 1978 treatise,
New Concepts in Technical Trading Systems. My review of
The Vortex Indicator is showing some promise, especially in longer-term trend analysis.
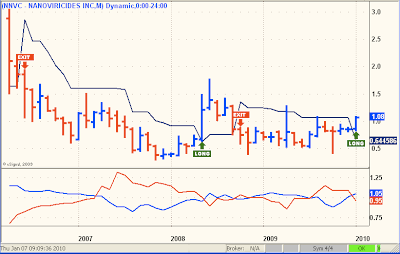
Below is a
Monthly chart of NNVC, updated with today's prices and
The Vortex Indicator (lower panel):
NNVC Monthly with Vortex Indicator
Note the cross-over in the indicator, suggesting a major bullish trend change. Here is a Weekly version of the same chart:
Again, note the bullish Vortex cross-over
Finally, a Daily look at NNVC and Vortex:
NNVC Daily with Vortex Indicator
A


4 comments:
Thanks,
Great explanation today, w/simple views.
PEACE
SE
It's interesting to note when the cross in the Vortex indicator lines up with a change in the ATR indicator. Very powerful!
Eric
The next pullback might be the last good entry point under 1.00.
barring a major market correction/collapse.and even with that correction coming the nnvc chart has strong support at .70
Any falling below .70 in a big market downturn would make me nervous.
For now, the wave + price action looks like a subwave 3 completing. the pullback would be subwave 4...I'd be looking at a support holding around 86 to 89 completing subwave 4,and subwave 5 trying to break through 1.00 again.subwave 4 could stretch out in a range between 85 and 1.00...and if/when subwave 5 breaks above 1.00 ,target looks like the 1.40 area.
I saw a hesitation s/r point around 1.20 on the way to 1.40
Folks looking to get into nnvc ought to see a 'last chance ?' at the .89 pullback area in the coming days/weeks.
and beyond that,if greater markets make a bigger downturn going through february,as many predict, you might see .89 broken down and then .80 and maybe as low as .70 would be s/r entry points.
The risk of not buying at 89 is that NNVC stays above 1.00 from now on. and that the 'market' stays long against all odds,common sense,and true market principles...i.e. welcome to the 'new normal' rigged game bubble economy.buy buy buy,until the market crashes and catches you by surprize again.
But since NNVC is a special investment,meant to be a buy and hold.... buying at .89 seems to make sense,buying again below .89 ,at .80,and again at .70 area,and one last buy at 55 area if it gets that far down. would be the likely dips.
Since there is a 'conflict of market energy' between the current market ready to roll over ....and NNVC ready to climb Upward,
Its impossible to know in advance what price will do IF market takes a big downturn in the coming weeks.
Personally,since I have a core holding I wont jump onboard NNVC at 1.00,but would buy more at .89
My trendline analysis is suggesting that price will pullback,and zig zag up and down in a range for the next few weeks. between 85 and 1.00.
It appears to be a question of TIME playing out. Similar to what price did through the fall months.
I sense that it will be 'waiting' for the major correction to play out,anticipating the months of february and march as a correction time,looking at late march and april as the reversal time to go to long.(after a 2 month(roughly) correction .( I anticipate somewhere down to the July 2008 Low,or the August 17 Low,June 3 top,somewhere around these s/r points. but not the March 2008 bottom. (this is not advise,just speculation)
Market cycle timers I follow are forecasting the same time frames.
Allan,
I can't find any articles in scientific or medical journals about Nanoviricides. Could this be a red flag. Looking at the PR reports, it would seem that they should have had a cuple of writeups in such journals.
Post a Comment