Sunday, May 31, 2009

Another speculative gold pick

Gold had another good day on Friday and the gold stock charts I look at are all looking very strong. They always do, at tops, but they also always do at the beginning of longer-term trends. Which will it be this time?

Famous stock picker Sir Isaac Newton stated that a stock in motion will continue to stay in motion until it changes its motion.....or something like that. Which brings me to NovaGold.


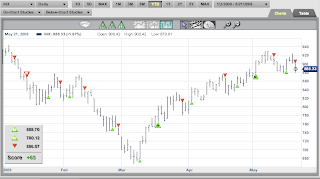
NG - Daily


Again, we see the power of a rule-based technical analysis system that works, Blue Wave (there's a link to the Blue Wave site at the bottom of this blog's cover page).


NG - 120 Minute


Buying a stock in the middle of a Wave 3 advance is risky. But probably more risky then not buying it and waiting for a pull back. It doesn't take much more momentum to take a $5 stock to $7.50 and then to $10.00.

On the fundamental side, this blurb from Steven Leeb's newsletter was posted on the Yahoo message boards this weekend:

“This company currently owns 50% of one of the world’s largest undeveloped copper and gold deposits. Located right in North America, the deposit contains some 8.9 billion measured and indicated pounds of copper, plus another 3 billion pounds inferred. (Copper prices are likely to escalate sharply on any hint of an economic recovery.) More importantly, the deposit holds 7.3 million measured and indicated ounces of gold, plus 3.8 million ounces inferred.

“And that’s just one of the company’s properties. It’s second major property contains some 29.3 measured and inferred ounces of gold. At $950 per ounce, that works out to nearly $28 billion for this property alone. Yet, you could buy this entire company today for roughly $900 million.

“Of course, owning a deposit is one thing, producing the gold is another. But this company has attracted the attention of some pretty big players. A couple of years ago, when gold was selling for just $675, Barrick offered to buy this company for $15 a share.”
In other words, with Gold 33% lower at $675/oz, Barrick thought the company was worth $15, about three times today's share price with Gold at $980.


Two hours until game time, need to get ready, time for my pre-game skate and some stretching.


A

Saturday, May 30, 2009

Weekly Analytics

Below is the Weekly SPX chart. Pay special attention to the Wave 2 and Wave 4 tops and in particular how the final stages of those tops were essentially sideways affairs, when looking at Weekly bars.


Sideways markets, where days alternate with up 100 and down 100 points, frustrate bull and bear alike. In the end, the next wave triggers with few aboard, "The Tau of the Dow."

Below an update on the Weekly SLV chart:


Initial EW analysis suggests a breakout looming. Still waiting for definitive confirmation.


Below the 120 Minute TBT chart. My last posting of this chart was unfortunately just before the top of Wave 3. Blue Wave caught the decline early enough to side step most of it, but a good example, nonetheless, why the shorter term moves need something more then my occasional updates to trade.


Below is the Daily VIX chart. I've drawn a Trend Regression channel coming down from the 4th Wave high. Remember that this indicator goes opposite equity index prices. So a Buy signal here is a Sell signal for the markets. A break out above the Regression channel will present our first hard evidence that the Wave 5 decline to new S&P lows is at hand.


Finally, a reader asked me about what Blue Wave had to say about CEPH:


A

Friday, May 29, 2009

Silver - update


Just after Friday's open, SLV is bumping up against the two channel tops shown above. There's a divergence on the stochastic in addition to it's overbought look. This is one of those instances where buying higher is the better strategy.

A

Thursday, May 28, 2009

TBT

As long as I am in posting mode, here is the Hourly TBT chart, targeting 63-68 for this move:


A

A look at Silver

This is a Weekly chart of SLV, the Silver ETF:


Bumping off of two major trend lines, SLV is up against major resistance. The significance here is that if SLV were to break out up above both trend lines, it's likely the beginning of a major advance.


A

Updates - AUY & SWC

Both stocks confirming up trends, +5% since introduced:


AUY


SWC


A

OPTT

While waiting for Armageddon:


A

Wednesday, May 27, 2009

Karma


Gold: "Buy of a Lifetime"

Some interesting material just out from Robert Prechter on Gold, may be worth a read for those gold-minded investors among you.

A

-------------------------------------------------------------------

"Gold is setting itself up for "the buy of a lifetime."

---Robert Prechter

Do you invest in precious metals? Should you?

Only you can answer the first question; we've written this letter to help you with the second.

Gold bugs have long touted the yellow metal's time-tested store of value. But, contrary to popular opinion, gold isn't always the best investment when times get tough – and we have the analysis to prove it.

Our friends at Elliott Wave International have just released a brand-new eBook that will help you decide just how – and when – gold and silver should be put to work in your portfolio.

Among the unique insights in this free eBook are 6 eye-opening tables that reveal how gold and silver performed vs. stocks and T-notes during each of the 11 recession-expansion cycles of the past 100 years. These tables alone are worthy of a high price tag, but you can download them for free.

You'll also get valuable analysis for gold stocks, precious coins and more – all at no cost.

If you have even the slightest interest in gold and silver, you must consult this free 40-page eBook now. It will show you how to invest in precious metals safely and successfully like no other resource can.

Learn more about the free 40-page Gold and Silver eBook here.


Taking every sell

Based on the Weekly SPX chart that I have been posting for three months now, we are in a window from which a major turn down could assert itself. Therefore I am taking every Sell on the 120 Minute Blue Wave chart, especially where EW (Elliott Wave) or FBS (False Bar Stochastic) are confirming.


Below are three tradables with prices presented as a line so its easier to see the uncanny accuracy of BW trades. Note also the EW counts and FBS confirmations.


FAZ triggered Long today at $5.16, closing at $5.38.

SPX triggered Short today at 898.58, closing at 893.06.

TBT triggered Long yesterday at $50.21, closing today at $57.20.


A

Tuesday, May 26, 2009

Who knows where the count goes?

In the 120 minute chart of the SPX below, two tools, Elliott Wave count and Blue Wave trend model. In this particular chart, EW is inconclusive, but the BW model doesn't look at waves or trend lines support or resistance, it has all it needs in price bars.


BW went long this morning at 893 and held long all day, capturing 17 S&P points. The reversal Short level for tomorrow is 896.95.


The above Weekly chart remains in a 4th Wave correction and will confirm the beginning of the 5th wave down at 839.67 basis BW, but I hope to get short a lot earlier on a shorter-term model.

I posted this trade on Twitter (allanpharris) this morning, long TBT which is an leveraged ETF way of shorting bonds:


A

On the making of war

New video from David Gordon's excellent Blog, "War Made Easy."


"War Made Easy reaches into the Orwellian memory hole to expose a 50-year pattern of government deception and media spin that has dragged the United States into one war after another from Vietnam to Iraq. Narrated by actor and activist Sean Penn, the film exhumes remarkable archival footage of official distortion and exaggeration from LBJ to George W. Bush, revealing in stunning detail how the American news media have uncritically disseminated the pro-war messages of successive presidential administrations."

Full Video here.


A

Monday, May 25, 2009

Gold & Silver stocks

Last week I suggested AUY was breaking out on a very strong chart pattern. Yesterday's post on Platinum made similar observations. Today I'm looking at the Philadelphia Gold & Silver Sector Index.

XAU

The big picture Weekly chart looks to be breaking out above 150 with an initial target of 225:


This is confirmed in the 120 minute shorter-term chart, suggesting about a 10 point risk (Blue Wave stop level) for about a 75 point gain:


The individual stock components of the XAU:


A weak dollar, geopolitical concerns and the potential flight to safety in the next down leg of the global financial markets all contribute to fundamentals underlying the bullish chart patterns.

Odds & Ends

Insider Buying

I received some requests recently to be added to the Insider-buying mailing list, "Sally." Unfortunately, we discontinued the list late last year, due to some time constraints as well as the drying up of quality insider buying. For an excellent summary of what we were doing and what has been happening recently in this area, I recommend the following article by two of the original members of our insider buying project: Insider Buys - Methods and Strategy.


Moderation

Having to moderate comments is a pain and I have temporarily removed moderation to make my work easier and to promote a free and open discussion of topics covered here. The two biggest no-no's are personal attacks and distortion of the truth. If they emerge again, either moderation goes back on, or comments will be disabled completely. There is virtually nothing that can't be said in response to blogs or other comments that can't be written without resorting to personal attacks or misrepresentations. In other words, be engaging without being destructive. The collective ideas and thoughts of the followers of this blog are highly valued by me and would be a terrible loss if a few mudslingers were to ruin it for all.


NNVC

I met with Dr. Eugene Seymour, CEO of NanoViricides a couple of weeks ago. Although we have spoken many times on the phone and through email, this was our first face to face meeting. We talked for about two hours, although Dr. Seymour did most of the talking. Hearing him embrace the company's potential was in a word, breathtaking. My five-year target for NNVC's stock price remains in the triple digits. If anything, it may be at the lower end of ultimate appreciation.


A

Sunday, May 24, 2009

Platinum


Let's start off with a Trade Triangle chart on Platinum. As you can see, a clear uptrend with both Monthly and Weekly Up Triangles:


The best looking Platinum mining stock charts are Stillwater Mining (North America) and Impala Platinum (Africa).


Impala Platinum


This is the world's second largest producer of Platinum, but, it's subject to geopolitical crap, it's traded here on the pink sheets and there's a currency component that is hard to integrate into picture going forward. Chart is there, but a lot of question markets thereafter. If you are comfortable with the contingencies, go for it.


Stillwater Mining


SWC was a $20 stock 18 months ago, now trading for $6 and change. On the above Weekly chart, it is coming out of a nice rounded bottom formation.


The above 120 minute chart is showing a cycle of rally-plateau-rally-plateau. The Blue Wave models says just ignore everything but the trend, defined as blue bars and up on both the Weekly and 120 minute charts.

You don't have to buy into conspiracies or hot tips to go long here. The trend on the Weekly chart is clearly rising and the shorter-term chart and triangle analysis confirms.

You came here to make money trading and this is how its done. You find something going up and you buy it. You find something going down and you short it. Let your profits run, cut your losses short. Take you ideas wherever you can find them.

A

An almost perfect storm

The charts below contain my most important tools and indicators. They will define my trading going forward, just as they have in the past. With each chart a brief comment stating the obvious.

Weekly SPX


The bars remain blue going into next week. But the False Bar Stochastic, channels and wave count are all warning that the end of a multi-month corrective Wave 4 is upon us. Still unconfirmed, but running out of room and running on fumes.

Daily SPX


The Daily chart above flipped SHORT last week. The wave count and FBS are warning that another leg up is possible, maybe even probable. A recovery from last week's decline would certainly suck in a lot bullish sentiment, just the psychology needed for the icing on that Weekly Wave 4 end, a culmination rally sucker-punching the bears.


240 minute SPX


Not all charts help the analysis, as is the case with the above 240 minute chart. But it does define our dilemma; Which way, which way?

30 minute SPX


So we drill down to a chart that does add tactical perspective. At first glance, this looks eerily close to the Weekly chart. But it's a 30 minute SPX. The portrait here is of a definitive end to a Wave 4 correction and the first red bar of Wave 5 down. On the shortest tactical time frame we see what could be the beginning of a massive bearish formation that will infect all of the above charts and bring into the play a significant decline, or more accurately, the significant decline.

Bottom line is that the resumption of the Bear Market in a big, big way is upon us. If it hasn't started yet, it will soon enough. Significant weakness next week will seal the deal. Absent that, another week, maybe two will be needed for an almost perfect set-up for an almost perfect storm.


A

Saturday, May 23, 2009

Priory guest blog

My recent publication of The Bilderberg Depression has received a lot of attention across much of the blogosphere. It appears to have hit a nerve as immediately upon its publication my blog's daily hit count increased by about 25%. More significantly for us, it has brought someone out into the open (relatively) who has been contributing to this blog through his ideas and forecasts for about the past 18 months. Some of my very best "lucky guesses" from past blogs were the direct result of information passed along to me by this mystery voice. Up until the Bilderberg post, he had asked me not to disclose his participation, relationship to me, or even his existence.

But The Bilderberg Depression has changed all that. Within an hour of publication of that blog I heard from him. As in the past, he again wanted me to pass along some information through this blog. Only this time I persuaded him to post himself. The post below was his response and I can attest to the veracity of everything disclosed in the post that relates to me and my relationship this individual and his group.

I have known this person since my days as an attorney in Georgia. The circumstances surrounding how and in what capacity we met is not something I can disclose. Nonetheless, he has never suggested anything to me that did not occur just as he described it would. The accuracy of his forecasts and the breadth of knowledge he has shared with me over the years suggests very strongly that what he describes in this blog is a reality. Those of you who have been with me for the past five years should realize that credibility is a big deal to me and accordingly, this source would not be appearing here, nor posting, if I wasn't absolutely convinced of his authenticity and the credibility of his observations.

That's about all he agreed I could say by way of an introduction to him. I now cede (temporarily) the AllAllan podium to him so he can say the rest in his own words.

A

--------------------------------------------
I am posting this at your request to do so, but would not do so otherwise. But I and my organization owe you so much we will acquiesce to your requests.

Although I cannot give my name, you and I know each other well (for over two decades) and I am a long time reader of your blog and have personally become a multimillionaire investing in your hedge fund and managed accounts.

My organization, The Priory of Sion is also involved in making money for its super secret endeavors using your information and we have brought in nearly $40MM USD, but primarily denominated in euros, following your blog. As you can personally attest to, we recently donated $100,000 USD to your blog and its activities.

We have considerable influence over the geopolitical events of the world. We agree with main conclusion of the other group you referred to in an earlier post and do expect and are betting millions on a severe downturn in the global equity markets. We are heavily short the US and dependent markets, long the metals, especially platinum, through which we control via direct bullion. We anticipate a downgrade of US debt in the coming years which will cause a financial Armageddon.

We are using our influence to effect the negative corrective change needed by decades of global excess, greed, avarice and lack of truly Holy Values.

Both I and the group wish to publicly thank you for your pure existence.

Friday, May 22, 2009

Yo' mama gold


I'm in.


A

FAZ & TBT

A quick look at FAZ and TBT:


Note the False Bar Stochastic as well as the levels where both instruments reverse their current trends.


A

Blue morning

This morning is a great example of how important it is to distinguish trading from forecasting.


What is appearing pre-market are blue BUY bars. These must be respected, especially if they remain blue after the opening bell.

But note the two levels at which the trend reverts back to SHORT:

SPY = 89.10

QQQQ = 33.56


The Triangles from Market Club offer no help here, Daily Sell, Weekly and Monthly Buys:


A lot of scenarios to play out making with patience and discipline a trader's two most important tools.


A

Thursday, May 21, 2009

For Sarah, my baby girl

Two views of market decline

First, pure trend following (Daily charts):


Looks pretty dire, eh?

Let's add some Elliott Wave analysis:


Just a mild Wave 4 before final push up?

Throw in a three-day weekend and possible downgrade of USA credit....

...heck if it was easy, everyone would be a trader.


A

Bonds Down Yields Up


Look how well TBT trades via the 120 minute chart. TBT traces bond yields, as yields go up, so does TBT.

Another example of trend following made easy via Blue Wave models.

A

VIX

Here is a daily chart of the VIX. This index runs counter the S&P meaning a Buy signal on the VIX is a Sell signal for the S&P.


The lower right hand side of the VIX chart shows three "5's" indicating that a completed 5 wave down move is at hand. This 5 wave down sequence began at last November's price lows with the VIX above 80. If VIX is headed back above 80, the market is in big, big trouble.

The 120 minute VIX is already Long:


One more brick in the wall......


A

A nefarious mind

Allan Harris (URL) said: May. 21, 9:00 AM

I've read this story now on three web sites and not one person has observed the glaring truth about both Cramer and CNBC: Cramer is just an average, mundane, but loud stock picker, not the trading-God that both he and CNBC tout him as to an unsuspecting audience. His only public, real time portfolio, "Action Alerts" has lost money since inception, while Cramer himself has racked up millions with false bravado, false advertising and a reckless disregard for the truth.


PROOF: Cramer Isn't A Lousy Stockpicker!


Henry Blodget|May. 20, 2009, 8:43 PM|18

Finally, we have an answer.

After years to Jim Cramer bragging about what a great stockpicker he is and of choruses of Mad Money viewers grousing about the opposite, the issue has been settled.

Paul Bolster and Emery Trahan of Northeastern University have done an exaustive analysis of Cramer's Mad Money stock picks from 2005 to 2007 (pre-crash).

The answer?

Cramer's not an awful stockpicker!

Unfortunately, he's not a particularly good one, either.

In fact, once you adjust for the various style factors that explain most stock returns (market, small/large, value/growth, momentum), Cramer's stockpicking is pretty much in line with the index. In other words, he's average.

Also, in contrast to one of Cramer's refrains about the mediocrity of passive investment strategies like Jack Bogle's, once you subtract the costs of trading and taxes (not to mention the incalculable cost of having to watch Cramer's show every night), you'd have been better off in an index fund.

Individual investors have an incredible variety of sources for investment guidance. These include
internet blogs, financial publications, books, newsletters and, of course, television shows. We examine a relatively new but widely popular source of investment advice, buy and sell
recommendations made by Jim Cramer on his popular nightly Mad Money show on CNBC.......
Overall, the results suggest that, while Cramer may be entertaining and mesmerizing to many of his viewers, his aggregate or average stock recommendations are neither extraordinarily good nor unusually bad.

The Details

Bolster and Emery's study is embedded below. Here are some of the interesting points.

On a gross basis, Cramer's picks actually did quite well, especially relative to the S&P 500. Cramer's "portfolio" (as constructed by Bolster and Emery) returned 12.1% per year, versus 7.4% for the S&P, providing lots of fodder for those who say he "beats the market." This performance was before trading costs and taxes, however. And the comparison to the S&P also does not take into account the type of stocks Cramer likes to buy (generally, small cap, value, and momentum stocks, which, as a group, outperformed the S&P).

After adjusting for transaction costs of $9.99 per trade, Cramer's performance was still better than the S&P 500, but only modestly. Transaction costs, even low ones, take a huge bite out of returns. After taxes, moreover, the performance of Cramer's picks would have suffered further. (One of the reason active investment strategies like Cramer's are unwise for the vast majority of investors is that it's so hard to overcome the costs of implementing them. To actually make you money relative to an index fund, Cramer would have to be an absolute stockpicking wizard.)
After adjusting for the four "factors" that explain most stock performance (market, size, value/growth, and momentum), Cramer's stockpicking was in line with the market. In this sample period, one could replicate Cramer's performance by constructing an index composed of 18% Russell 1000 Growth, 29% Russell 1000 Value, and 53% Russell 2000 Growth.
Bolster and Emery conclude:

Our factor analysis of portfolio performance for the entire period of analysis suggests that factor-adjusted returns are generally not significantly different from zero. Multivariate analysis suggests that Cramer’s portfolio returns are driven by beta exposure, smaller stocks, value-oriented stocks, and momentum effects. However, when we look at performance year by year, it is clear that Cramer has reduced his reliance on high beta stocks and has shifted away from value and toward growth. This shift is further evidenced by style analysis which shows a significant shift from large cap value to large cap growth in 2007.

The full period results provide little compelling information that Cramer’s recommendations are extraordinarily good or unusually bad. However, the year by year results are more intriguing. In particular, Cramer’s robust performance in 2007 results from a clear shift from value to growth, particularly in large cap stocks. A 3-factor Fama-French model even provides a significantly positive alpha for 2007. Yet, this model produced a significantly negative alpha for 2006. Thus, we find inconsistent evidence of Cramer’s ability to add value through security selection. But he has an advantage over the typical mutual fund manager: he is not trapped in a style box. This worked to his advantage in 2007. The obvious question: can he exploit this flexibility effectively and consistently in the future?

We know what Jim's answer would be to that one!

Wednesday, May 20, 2009

Panorama of a top?

Here are the Wednesday's closing charts of interest:

First, the 120 minute swing chart with today's Blue Wave SELL SIGNAL:


Next, we pan out for better perspective, the Daily chart:


Finally, our main compass, the Weekly chart:


The big kahuna we wait for is the Weekly Sell Signal. But by simple deductive reasoning, this Weekly SELL will come only after a Daily SELL which itself will come after the 120 minute SELL SIGNAL.

It doesn't follow that every 120 minute SELL will lead to the Weekly SELL, or even that this one will...but it might.


A