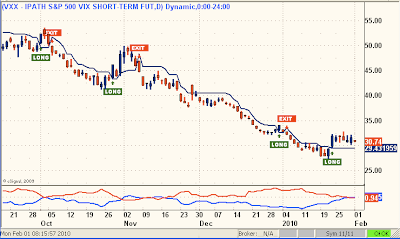
VXX Daily Trend Model
I've been having success trading VXX on mush shorter time frames, using 30 and 15 minute models trying to catch intra-day changes in market volatility and direction. Longer-term, the Daily chart might be an effective intermediate directional tool. Note how the Vortex indicator is now neutral as VXX consolidates recent gains.
According to this model, it would take a VXX daily close below 29.43 to suggest the market has reversed to a more bullish bias.

6 comments:
wishing i had bought isco instead of nnvc
isco tripled since agora newsletter in early january
yeah i noticed isco, nice move
So goes ISCO!
By Patrick Cox | December 30, 2009
"My sources tell me that on Febuary 5, 2010 the CEO (who I’ll introduce to you in just a moment) will cover his firm’s “roadmap” for 2010 and the years ahead. My sources report he has some amazing news to share…
To put this “roadmap” in context — it could prove to be on par with Albert Einstein telling his peers about The Theory of Relativity — months before he went public with it.
It’s amazing. But more importantly it could make you incredibly rich."
i read that, i wish the hell i got that instead of nnvc, this just seems to go down
Do not be Discouraged...
NNVC..will bring you financial stability and security..
Sooner or later...
For a company on the cutting edge with their technology, their web site looks outdated,
Post a Comment