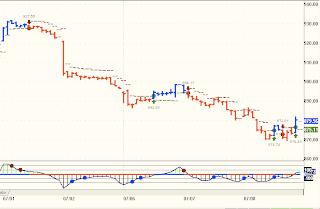
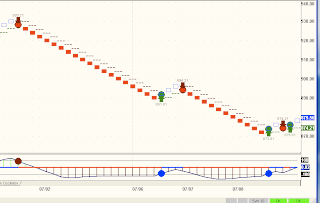
Below are three
SPX charts covering
July trading based on the
Blue Wave Trend Model. The charts differ only in the manner prices and signals are generated from raw data to chart format. The three formats are
Bar,
Renko and
3-Line Point Break. Under the charts I've compiled a
Summary of Trades table comparing the three formats and their respective trades.


18 comments:
How did you calculate the point totals? Did you wait for the signal bars to close? I don't see how the 3-line chart would ever work in realtime if you calculated the entry on bar close. If you don't wait for the bar to close then you'd have tons of false signals that aren't on your chart (i.e. losses).
On my eSignal charts,I can monitor a data window that includes the BW stop/reversal levels. I've already pointed out that my triggers are based on these levels, not the actual closing of the bar, which as you suggest, is not practicable. As far as false signals go, they do appear on occasion, but not often enough to materially effect results.
Okay. I suppose that may be true on long timeframe charts. I can tell you for a fact that not waiting for the bar to close on a 6 range chart is often the difference between profit and a stop-out. BWT will plot the entries intrabar but you better not take them.
I can't see using BWT on an intrabar basis...
I wait for a close of the bar...and more importantly than just having a new paint bar...I only take takes where CCI, Tic Vol and BBand, (or at least 2 of the 3), are showing strong confirmation.
Using much longer time frame than a 6 range...so can afford the gap up...as long as price is reasonably within natural bands.
Cherry picking from about 75 instruments.
-Mike
"I can tell you for a fact that not waiting for the bar to close on a 6 range chart is often the difference between profit and a stop-out."
Sounds like ML is reading up on some Al Brooks on price action. The people on this blog are so well informed and smart it is hard stay in the pack. TY for a great blog Allan.
Allan,
You said Prechter is looking for another wave up before the crash. How far up could it go?
>ML is reading up on some Al Brooks
lol. I am reading Brooks right now but I was speaking from experience on the timeframe that I trade.
>much longer time frame than a 6 range
The significance of range varies with the instrument, of course. I only trade ES. 6 range keeps the typical stop/reversal to 3 points and that's what I'm comfortable with on daytrade position sizes (3-4x larger than what I'd consider swing trading).
Hi Allan,
Does the esignal/bluewave combo allow you to somehow auto-update a pending stop-loss order at a brokerage house like optionsxpress, etc, say at the end of a given period-bar to catch a direction change ? or do you have to keep an eye out and adjust your order every so often ?
Thanks,
Satbir
allan
market club gave a red triangle today on nnvc, does it give false singal sometimes? cause nnvc closed at the high of the day with a very small trading range all day
thanks rob
U. S. Attorney Joseph Facciponte made the following statement today regarding the theft of Goldman Sachs trading platform as reproted on Yahoo.
"because the way that this software interfaces with the various markets and exchanges, the bank (GS) has warned it could be used to manipulate the markets in unfair ways."
Hmmm, Obama, Paulson, Bernanke, Geithner, Godlman Sachs, and a software that could be used to manipulate the markets in unfair ways??? Allan are we trading in "The Matrix?" Sure feels like someone threw a switch on March 6, when was the last time a new president called a major market bottom to the exact day if I am not mistaken?
The public isn't aware of intraday prices, just the close.
It would be very interesting to analyze the last half hour of trading from the perspective of someone trying to support the market rather than make a profit.
In that case, the meaningful intervention would occur during real bad days and on other days it would be a ruse to cover their tracks. I wonder how the volume differs between the real bad day close and the real good day close (and the flat days for that matter).
Rob, Pulling up NNVC on Market Club this morning I see an Up arrow yesterday on Daily time frame and Down arrows in effect for both Weekly and Monthly time frames. As I have written previously, I don't "trade" NNVC, so I don't stay on top of short term trading indicators. The story here continues unabated and when I have the time, I'll devote an entire blog to their recent progress in r&d.
Allan,
something reacting in NNVC
need only a catalyst
serge
Since you guys were talking about Ravi Batra..... does anyone think Jim Sinclair is the modern day equivalent? He's been telling everyone to prepare for the apocalypse for some time now.
does anyone have an idea why faz just had a 10-1 reverse split its now over $50 a share thanks
Learn how these funds are put together and who your counter party is before you trade them
http://blog.afraidtotrade.com/faz-3x-financial-bear-fund-crushed/
re: faz
low price creating havoc:
http://247wallst.com/2009/06/23/more-reverse-splits-or-just-closure-possible-or-needed-fas-faz-uyg-bac-bhh-arba-iih-akam-vrsn-ung-uso-gld-sds-spy-nyx-ndaq/
similar case with ung being yesterday...
something to that effect.
-Mike
*with ung being (halted) yesterday...
Post a Comment