I just made a quick trip to Starbucks and realized what is wrong with our economy, in fact, in our society:
(1) Traffic lights. This is getting out of hand. I counted seven lights in the one mile trip to Starbucks. What do all of these sick jokes cost us? How about the anger and frustration, especially as a result of those self-absorbed, callous and cold-blooded drivers who trigger lights by radar coming out of some dinky side-street? How about the extra fuel used while idling at forever red lights? I'll bet we could be self-sufficient in oil just by cutting down 10% of traffic lights in our major cities. Or the wear and tear on brakes and the who knows what that black crap is being sent into the atmosphere every time our brakes are applied;
(2) Parking lot speed bumps. Why are they so high? They are more like walls then bumps, I have to speed up just to get the momentum to get over some of them;
(3) Photo-radar. George Orwell would have a field day with these big-brother intrusions into our privacy and well-being. How can a society be productive while we cower in fear every time we drive to a store or work, or to visit a sick relative in the hospital, or worse yet, a trip downtown to feed the hungry or to save the lives of children caught in house fires.
I imagine those UFO's are laughing there oval heads off as they hover and observe our species subverting our mobile technology and destroying what dignity we have left as a civilization.
Power to the people.
Monday, October 18, 2010


Another Monday
Not much commentary is needed here. A 240 minute chart of the DJIA covering the past three months, the DJIA Trend Model, the current price of the index and the reversal level needed to reverse the trend SHORT.
Everything else is just noise.

Everything else is just noise.

Sunday, October 17, 2010
Another Sunday
Another Sunday and as usual, we depart from the markets for something warmer, more lyrical and usually very personal.
Here is our deal, I provide market insights the rest of the week, you read and listen to the words and music (in its entirety) found here on Sundays.
Deal?
If a song appears here a second time, its not a mistake, it is just that much more meaningful. If it appears without much commentary from me, it is even more meaningful.
Deal?
A
Here is our deal, I provide market insights the rest of the week, you read and listen to the words and music (in its entirety) found here on Sundays.
Deal?
If a song appears here a second time, its not a mistake, it is just that much more meaningful. If it appears without much commentary from me, it is even more meaningful.
Deal?
A
Thursday, October 14, 2010
Something wicked this way comes
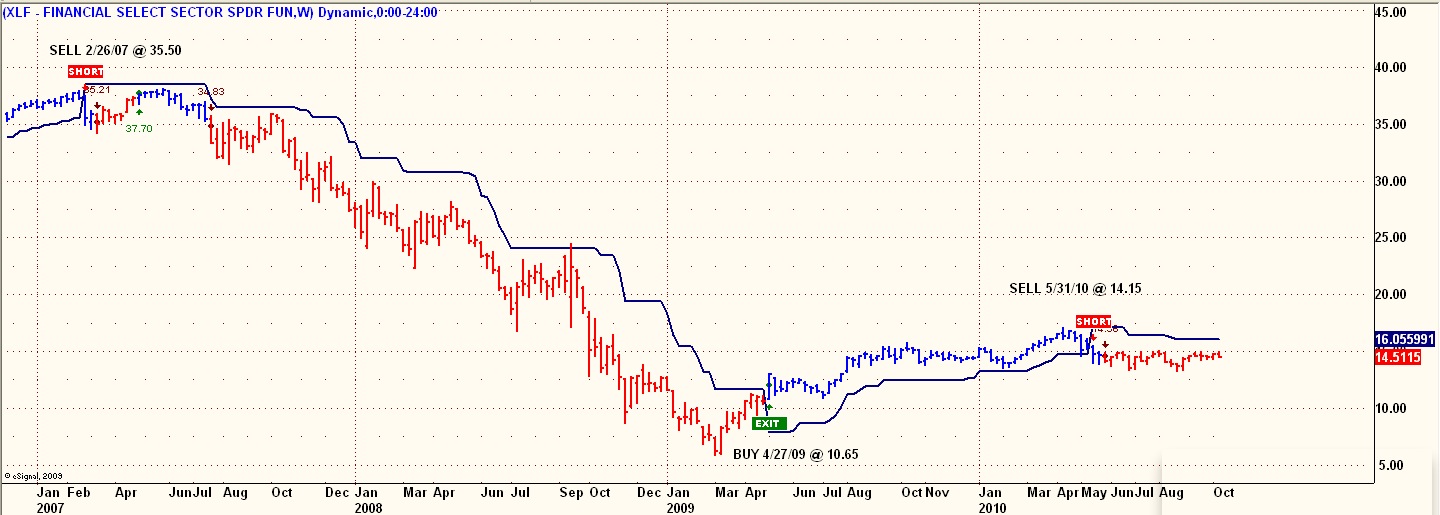
I just have to post this chart. The market last topped in October, 2007. But look here, the financials as represented by XLF, peaked in February, 2007:

XLF Weekly Trend Model
This year, XLF reversed SHORT in May and remains SHORT, although a little underwater as of today. But as shown on the above chart, the SHORT signal of early 2007 was also underwater for several weeks before the XLF came crashing down with a 71% decline.
Another omen that something wicked this way comes.
A
A
SPX, Dollar & Wings
How important is the value of the dollar for stocks? For some insight into this relationship, here are two charts, UUP for the dollar and SPX for the stock market:


This looks like a step for step correlation to me. The implication is that no meaningful decline in the market should take place without a corresponding rise in the dollar.
Which leads me to the Detroit Red Wings. Las Vegas has them at 10-1 to win the Stanley Cup this season. I have them at 1-1. This discrepancy could end up being the best bet of all, regardless of the value of the dollar or level of the SPX.
In any case, three markers to keep an eye on in the coming months.
A

UUP Daily Trend Model

SPX Daily Trend Model
This looks like a step for step correlation to me. The implication is that no meaningful decline in the market should take place without a corresponding rise in the dollar.
Which leads me to the Detroit Red Wings. Las Vegas has them at 10-1 to win the Stanley Cup this season. I have them at 1-1. This discrepancy could end up being the best bet of all, regardless of the value of the dollar or level of the SPX.
In any case, three markers to keep an eye on in the coming months.
A
Tuesday, October 12, 2010
NNVC - update
Below is a multi-year chart of the NNVC_Weekly Trend Model. Particularly illustrative of the power of this model are the LONG signals.

The first LONG was in October of 2005, which was triggered at $0.30 after which NNVC ran to a high of $3.75 in about six months. The next LONG was in February of 2008, which was triggered at $0.70 after which NNVC ran to a high of $1.78 in about 4 months. Finally a LONG was triggered in September of 2009 at $0.93 after which NNVC ran to a high of $2.64 in May of 2010.
The next LONG will be triggered, as of today, at $1.58. That number is dropping with every new week and NNVC is very close to a Daily LONG signal which does allow entry well before the Weekly trigger. As with any shorter term model, the Daily is more volatile then the Weekly and could reverse before mounting another drive up to the Weekly LONG trigger. Or, the stock could run right up to the Weekly trigger and never look back.
Who has the patience to trade these Weekly models? Those that like to win at this game. There is a lot of angst around at how long NNVC is taking to convince the world that they are the new standard, the new paradigm in anti-viral treatment of some of the worlds most virulent diseases. One thing is for sure, the trend models will get on board this stock well before the news that will propel the share price to all time new highs and then some.
A

The first LONG was in October of 2005, which was triggered at $0.30 after which NNVC ran to a high of $3.75 in about six months. The next LONG was in February of 2008, which was triggered at $0.70 after which NNVC ran to a high of $1.78 in about 4 months. Finally a LONG was triggered in September of 2009 at $0.93 after which NNVC ran to a high of $2.64 in May of 2010.
The next LONG will be triggered, as of today, at $1.58. That number is dropping with every new week and NNVC is very close to a Daily LONG signal which does allow entry well before the Weekly trigger. As with any shorter term model, the Daily is more volatile then the Weekly and could reverse before mounting another drive up to the Weekly LONG trigger. Or, the stock could run right up to the Weekly trigger and never look back.
Who has the patience to trade these Weekly models? Those that like to win at this game. There is a lot of angst around at how long NNVC is taking to convince the world that they are the new standard, the new paradigm in anti-viral treatment of some of the worlds most virulent diseases. One thing is for sure, the trend models will get on board this stock well before the news that will propel the share price to all time new highs and then some.
A
Friday, October 08, 2010
Weekly Trend Models
I've been a stock trader for a long time, doing everything from day-trading, minute trading, swing trading and idiotic trading. But I have never gotten into weekly trading, even though some of the most successful hedge funds in the world generate outstanding performance from long term position trades based on weekly charts.
Below are some examples of good performing weekly trend models. In the spirit of past performance is not a guarantee of future results, along with Bob Prechter's thesis that something dramatic changed at the 2007 stock market highs, i.e. the beginning of a multi-year bear market that is now in its early stages, these particular charts using a weekly time frame and a low volatility setting illustrate that, yes, something has changed since 2007-8 and if it continues on its current path, weekly trend models should do very well in the years ahead.


Below are some examples of good performing weekly trend models. In the spirit of past performance is not a guarantee of future results, along with Bob Prechter's thesis that something dramatic changed at the 2007 stock market highs, i.e. the beginning of a multi-year bear market that is now in its early stages, these particular charts using a weekly time frame and a low volatility setting illustrate that, yes, something has changed since 2007-8 and if it continues on its current path, weekly trend models should do very well in the years ahead.

DJIA Weekly Trend Model
NASDAQ Weekly Trend Model

XLF Weekly Trend Model

GOOG Weekly Trend Model

BIDU Weekly Trend Model

GLD Weekly Trend Model

GORO Weekly Trend Model

GSS Weekly Trend Model

REE Weekly Trend Model
Tuesday, October 05, 2010
Gold and Silver 390 Minute Charts
Continuing on the 390 minutes theme, here are GLD and SLV 390 minute trend models:


My take away from these charts is that not only did the trend models give opportune entry signals, they also kept you in the two stocks for the entire extended run in share prices.


My take away from these charts is that not only did the trend models give opportune entry signals, they also kept you in the two stocks for the entire extended run in share prices.
Monday, October 04, 2010
390 Minutes
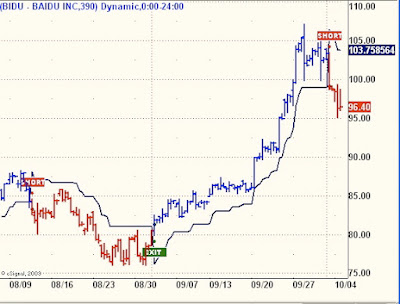
The most important time frame in my arsenal of trend models are the daily charts. They just seem to have the best balance between accuracy and frequency of trades. Since there are 390 minutes in each trading day, it might be illustrative, or even predictive to take a look at some 390 minute trend models on some bellwether stocks:



AAPL_390 Trend Model

BIDU_390 Trend Model

GS_390 Trend Model

PCLN_390 Trend Model

AMZN_390 Trend Model

GOOG_390 Trend Model
These last two, AMZN and GOOG have not yet reversed SHORT. This either means they are holding support in advance of a rip roaring bull market that will blow our socks off........or, they are about to flip SHORT and join the other key stocks in what could be quite a nasty decline.
It might help to let the right side of your brain (that's the intuitive part, if you have any of it left) handle this one.
A
A
Saturday, October 02, 2010
Trends in motion tend to stay in motion
The mantra around here for the past year or so has been Trend Following. My version of Trend Following has developed into a simple technique, based upon an algorithm which is objective and lends itself to a mechanical application to trading. But it wasn't always so.
A decade ago I came up with what I named, "The Two-Second Trading System (Three, if you live in California)" These are the rules:


A decade ago I came up with what I named, "The Two-Second Trading System (Three, if you live in California)" These are the rules:
(1) Look at a stock chart.
(2) Ask yourself one question:
“Do I wish that I already owned this stock?”
(3) If yes, it is a BUY; if no, it is a SELL.
Simple, almost eloquent, it utilized the intuitive self, or as science has named it, the right side of the brain. As it has morphed into my current Trend Models, it is still just as effective, only now it uses the left side of the brain, the analytical and sequential side. What follows is an example of both approaches working in tandem to make money in stocks.
On September 13th I posted on this blog two rare earth plays, REE & MCP. I had given them both to my subscriber list about 10 days earlier and at lower prices. Here are the two current charts with the Sep 13 BUY labeled:


The REE chart also includes the LONG generated by the Trend Model while MCP is a recent IPO so its very early LONG wasn't nearly as telling as REE's Trend Model Buy. Nonetheless, the take away from these examples is how Trend Following works (most of the time). At almost any place on these two charts, the Two-Second Trading System worked to get long as did both Trend Models which were long for almost the entire runs up in both stocks.
I think most traders would look at REE and MCP on September 13 and think that it was too late to buy, as both stocks were already UP in a significant way. Trend Followers would have none of that. Both these stocks were clearly in up-trends and the signal was BUY under the Two-Second test, as well via the Trend Models. There were no other considerations. To say it was too late to buy would be tantamount to saying, "These stocks are at top tick, there is nothing more to gain." What are the odds that anyone can pick top tick on anything?
This illustrates the core tenet of Trend Following: Trends in motion tend to stay in motion.
Since sent out to my subscribers, REE is up 70% and MCP is up 50%. Since posted here, REE is up 45% and MCP is up 25%. Yes, I picked two very profitable examples, they all don't do so well, especially only after two to four weeks. But they are conspicuous instances of Trend Following at its core, whether the left or right sides of the brain are called upon to make a decision.
I use them both, but that's me.
A
Subscribe to:
Posts (Atom)