Saturday, January 30, 2010

Find Something That Works. Then Trade it.

Below are some of the Daily Trend Models that my subscription email service has been covering this past month.  This is the final weekend that sign-ups will be locked in at $50/month.

The response from readers has been gratifying to say the least.  Your overwhelming support for this undertaking has been both flattering and inspirational, a catalyst for all of us to have a most excellent year trading on the right side of these markets in an objective, detached, empirical and most of all, successful manner in what could shape up to be one of the great investment opportunities of a generation.   

If so, there is no way these charts are going to miss it.

Find Something That Works.  

Then Trade It.


A

Friday, January 29, 2010

BIDU Weekly Trend Model

I wrote about the BIDU Weekly Trend Model back on January 10th.  In that post was a table of trades based on the model.

Below is a current BIDU Weekly Trend Model chart, about 30 minutes before the close of trading for the week:

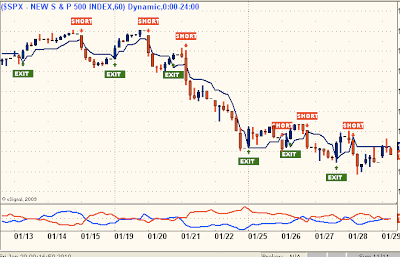
SPX Hourly Trend Model

SPX Hourly Trend Following Model


Note to subscribers:

The Long trigger level has changed slightly since the last email update, about 15 minutes ago.  These small changes aren't very significant unless the SPX is trading nearer to the actual threshold.  If that should happen, I'll quickly send a new update with the then current threshold.


A

Even shorter-term

SPX 5 minute 3-line break with Trend Following Model


Shorter term trend

Below is my Hourly SPX chart, noteworthy are all the bounces from below the trigger line that are failing to break-through as the SPX remains on a short-term Sell:

Back to the charts

DJIA 240 minute

I've drawn Fibonacci retracement levels on the 240 minute DJIA chart as a way of showing that even a GDP rally today is consistent with a new leg down having begun.  My Daily and Weekly S&P Models are still solidly in Sell modes, so unless those models were to flip Long, the rally, if any,  is counter-trend.

SSO Daily

A new subscriber asked me to follow SSO in the Daily Models on the subscription list.  Since some accounts can't short stocks, including SDS, alternating between SSO for Buys and SDS for Sells makes sense. 


Thursday, January 28, 2010

Eulogy

Among other things, you'll find that you're not the first person who was ever confused and frightened and even sickened by human behavior. You're by no means alone on that score, you'll be excited and stimulated to know. Many, many men have been just as troubled morally and spiritually as you are right now. Happily, some of them kept records of their troubles. You'll learn from them - if you want to. Just as someday, if you have something to offer, someone will learn something from you. It's a beautiful reciprocal arrangement. And it isn't education. It's history. It's poetry.
Chapter 24

I was half in love with her by the time we sat down.  That's the thing about girls.  Every time they do something pretty, even if they're not much to look at, or even if they're sort of stupid, you fall half in love with them, and then you never know where the hell you are.  Girls.  Jesus Christ.  They can drive you crazy.  They really can.  
Chapter 10

What really knocks me out is a book, when you're all done reading it, you wished the author that wrote it was a terrific friend of yours and you could call him up on the phone whenever you felt like it.
Chapter 3


The Catcher in the Rye
J. D. Salinger
1919-2010

Room with a view

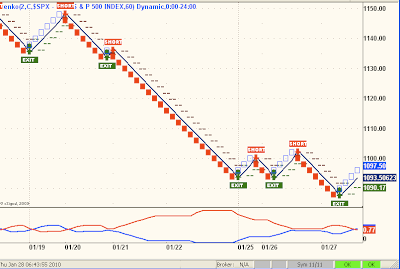
Three 60 minute charts of the S&P (SPX) from the perspectives of Renko, 3-Line Break and traditional Candlesticks.


Renko


3-Line Break


 Remnants of the Big Bang


Discussion

What's life? 
A magazine.
How much does it cost?
It cost 20c.
I only have a nickel.
That's tough.


Wednesday, January 27, 2010

Remnants of a big bang

Life is not fair.  But we all knew that. Makes one wonder about a supreme being, spiritual or otherwise.  Last Sunday I had the luxury of watching the NFC Championship game without caring who would win.  I like New Orleans as a city and feel that they deserve something because of Katrina.  As for Minnesota, suffice it to say Bret Favre and 309 consecutive starts at quarterback, an NFL record for any position, let alone quarterback.  Since September 27, 1992, the guy has never missed a game. So whoever won, thumbs-up.

Then the game happened.  One team totally dominated the other. The Vikings had 475 total yards to the Saints 257.  Yet the sports world is giddy over the Aint's going to the Super Bowl.  Minnesota was the better team.  But they lost due to five turnovers and some pretty clutch choking by their coaching staff at the end of regulation.  Still, the second best NFC team goes to Miami to play that team from Indiana, pleeeeze.

I didn't watch Obama tonight.  Why?  The guy has turned out to be a putz.  Another lying, thieving, consummate insider politician.  I voted with my heart, not my head.  My bad.  The first candidate I voted for since George McGovern and I pissed that away, just like Favre did Sunday's game. 

A friend of this Blog asked for this.  Something without charts, or stock picks, something human, maybe some music, something charming like I used to write.  It didn't start out like this, but the Red Wings lost badly tonight and do you know to who?  Minnesota of all teams.  Where is that written?  Who comes up with this shit?  Is there no sense to the universe, is it all just some random exhaust, remnants from a far away and long ago big bang?

Charming, my ass.


GNVC - update

I wrote up GNVC on January 14th at about $1.75. Although up about 10% in about two weeks, it did peak at $3.34 a few days ago before a sharp sell-off, due in part from today's news of an $28M stock offering


Today is the first Sell day on the Daily Trend Model, if GNVC closes today below $2.58, which seems likely. 


The above weekly chart will go Short on a close this week below $2.29. 


My Trend Models are an excellent way to stay on the right side of just about any tradable for any time frame. This holds for GNVC, NNVC and everything else in the trading universe.  Nonetheless, if you believe in the underlying story and don't want to be bothered with share price volatility, there is a place in portfolios for buy and hold stakes in these kind of story stocks. This is an individual decision based on an investors personal facts, circumstances, temperament, chakra and stomach. 

For me, I like to put these away and look only on weekends, when emotions are less effected by the mass psychology of the marketplace.  To each his/her own.

A

Keeping it simple


Tuesday, January 26, 2010

Vortex trades


CME Weekly


ICE Weekly

Prescient guidance


SPX 90 Minute


The end of a move?  The beginning of a move?  The middle of a move?


This might be where the Vortex Indicator provides prescient guidance.

Monday, January 25, 2010

Weekly DJIA


DJIA Weekly

Here is a weekly look at the US Stock Market via the Dow Jones Industrial Average, along with Advanced GET's wave count, the Vortex Indicator, False Bar Stochastic, Blue Wave Trend Indicator and my DJIA Weekly Trend Following Model. 

My take from this chart is that it will be much more important how this week ends, then how it is beginning.

A

Sunday, January 24, 2010

SRS

Halftime of the Jets - Colts game and I came across this chart. (Get a life.)  SRS is a 3X beta bear real estate ETF.  In November of 2008, it peaked north of $295.  Today, SRS is trading at $8 and change.


As you can see in the chart above, the Daily trend has turned up.  In light of some of the most dramatic and pessimistic forecasts out there, this one might be worth keeping an eye on. SRS has some intriguing looking option plays as well. Game on.

A

Trend Model Results

My Daily and Weekly SPX Trend Models started out 2010 on the Long side.  The SPX Daily Model flipped Short on January 21st at 1133.36 and the SPX Weekly Model flipped short on January 22nd at 1101.00.  Its too early to measure the profitability of these current signals, but we do have some individual stock results* that are revealing.

The GS Daily Model flipped SHORT on January 11th  at about 172 and GS is currently at about 154 for an unleveraged gain of about 10%


The GOOG Daily Model flipped SHORT on January 6th at about 616 and GOOG is currently at about 550 for an unleveraged gain of about 11%


The AMZN Daily Model flipped SHORT on January 6th at about 134 and AMZN is currently at about 121 for an unleveraged gain of about 10%


*HYPOTHETICAL OR SIMULATED PERFORMANCE RESULTS HAVE CERTAIN INHERENT LIMITATIONS. UNLIKE AN ACTUAL PERFORMANCE RECORD, SIMULATED RESULTS DO NOT REPRESENT ACTUAL TRADING AND MAY NOT BE IMPACTED BY BROKERAGE AND OTHER SLIPPAGE FEES. ALSO, SINCE THE TRADES HAVE NOT ACTUALLY BEEN EXECUTED, THE RESULTS MAY HAVE UNDER- OR OVER-COMPENSATED FOR THE IMPACT, IF ANY, OF CERTAIN MARKET FACTORS, SUCH AS LACK OF LIQUIDITY. SIMULATED TRADING PROGRAMS IN GENERAL ARE ALSO SUBJECT TO THE FACT THAT THEY ARE DESIGNED WITH THE BENEFIT OF HINDSIGHT. NO REPRESENTATION IS BEING MADE THAT ANY ACCOUNT WILL OR IS LIKELY TO ACHIEVE PROFITS OR LOSSES SIMILAR TO THOSE SHOWN.

"Hey Allan, what do you mean, 'Since the trades have not actually been executed?'"


Those charts and statistics above are of my Trend Following Trading Models, for which I send out periodic real-time emails to a private list of subscribers for a fee.  I have no control over how subscribers use this information, therefore I am not representing nor do I warranty that these trading models have been, can be,  or are profitable, or will continue to be profitable, or will ever be profitable.  That said, I personally played all three of the above models with options and got outstanding returns.  Go figure.


There is one more week remaining in the $50/month subscription rate. New subscriptions initiated after January 31, 2010 will be $100/month.  All subscriptions initiated in January, 2010 will be grandfathered in at the current rate of $50/month.  Eventually I expect to charge $250/month, maybe more and even then, the subscription service will be a bargain.  Watch me.


A

Saturday, January 23, 2010

NNVC - update

In the spirit of confirmatory analysis, a review of NNVC, both technically and fundamentally.  Let's start with the most objective analysis, a look at a longer-term trend chart.

The Weekly chart below is still LONG and will stay that way above $0.95.


But maybe more interesting is a Daily chart and the price movement that begins about ten days into January:


The big move here is from January 11th through 14th, from about $1.00 to a high of $1.29, a 29% pop in four days,  Why?  What happened on or about January 10th - 11th to merit such a pop?

There was a write up on NNVC by Agora Financial dated December 30, 2009.  That certainly raised public awareness of NanoViricides and contributed to higher prices.  But by the end of the first week of January, that horse had left the barn.

The there was this Press Release, dated January 11, 2010:


No, I don't think an announcement about presenting at a Biotechnology Conference is in and of itself responsible for an almost 30% pop in market capitalization.

But what may not have been given its due is the rest of that January 11th Press Release, where the real story of this company and its research and development successes was being told.

Let's take a closer look at what the company reported behind the headline above:
The Company now has four commercially important drugs in its pipeline, targeting a total market size of approximately $40 Billion. These drugs target HIV, all Influenzas, viral diseases of the external Eye, and Herpes Simplex viral infections including cold sores and genital herpes (HSV). In addition, the Company has R&D programs in collaborations with reputed institutions against several Neglected Tropical Diseases and agents of interest for Biosecurity. These include hemorrhagic fever viruses such as Ebola/Marburg, Dengue, and Rabies, among others.

Note that this $135M market cap company has four commercially important drugs in its pipeline targeting a total market size of approximately $40B.

Now read this from the very same press release:
The Company has previously reported that its anti-HIV drug candidate was >25X (or >2,500%) more effective than the oral HAART treatment comprising three drugs, on a drug load basis. This study employed a standard SCID-Hu Thy/Liv mouse model. Human lymphocytes implanted in a mouse, and infected with HIV, are treated with antiviral drugs in this model. It is very important to note that no adverse events were observed in the nanoviricide treated mice, while the HAART-treated mice exhibited clinical signs of side effects. HAART or “highly active anti-retroviral therapy” is a three-drug combination therapy currently in use in human clinical practice, and is regarded as the most effective therapeutic regimen against HIV. If these preliminary results are confirmed in further animal studies and in human clinical trials, the Company believes that HIVCide™ could very well result in a “Functional Cure” for HIV/AIDS.
Yes, you read it right, "the Company believes that "HIVCide™ could very well result in a Functional Cure for HIV/AIDS."

One more, indulge me:
The Company also recently reported that it has successfully added a new anti-HSV drug program to its pipeline this year. The Company‘s topical anti-herpes drug candidate has already demonstrated greater than 10,000-fold (>99.99%, or >4 logs) reduction in virus quantity in cell culture models of HSV-1 infection. Animal model studies of topical and genital herpes are planned.

Reduction in viral load of (>99.99% or > 4 logs)

Where does that leave this stock and just what does it matter exactly where theses shares are trading from one day to the next?
“We are now well poised to further develop our drug candidates with the objective of filing an IND application as soon as possible,” said Dr. Eugene Seymour, MD, MPH, CEO of the Company.
I read a lot of angst from shareholders of NNVC who bought in on the recent run up over $1.20 a share and are today underwater.  From a long time, very long time shareholder to you, I say, "Been there, done that."  Over the past 5 years I have been underwater on almost every share of NNVC which I purchased, including my first shares, bought at about 10c and swiftly underwater by 20% at 8c.  Last year at this time I bought more at 75c only to see it fall into the high 50c range in the course of two months.  When it fell 25% from my entry,  I bought more. 

Who wants to play musical chairs with these shares, trade in and out, risking being out when the news hits that any of the above projects achieves a reportable milestone, or,
In addition, the Company has R&D programs in collaborations with reputed institutions against several Neglected Tropical Diseases and agents of interest for Biosecurity. These include hemorrhagic fever viruses such as Ebola/Marburg, Dengue, and Rabies, among others.

 ....risk being out when one of those reputed institutions, or, agents of interest for Biosecurity, cuts a deal with NNVC seemingly out of the blue sending these shares soaring?

I have no interest in trading these shares, just holding tight and buying more should an opportunity arise.  I've done my research and am staying on top of the company, its shares and the diseases it is addressing with its products.  As I have told many of you privately, I don't watch day-to-day fluctuations of share price, because I don't care, not even about the chart first above.  My bet is on the table, the wheel is spinning and its time to sit back and enjoy the experience of being a part of a game-changing paradigm shifting medical miracle. 

A

Friday, January 22, 2010

GNVC - update

Last Thursday I highlighted GNVC here

At the time, it was trading at $1.75.  

Below is the Daily chart and just now breaking above $2.90, the embedded  EW analysis is suggesting that a five wave advance is on the way to $8.00


GNVC Daily


Sometimes, these work.


A

Glenn Neely: Multi-month decline

NEoWave's Glenn Neely Forecasts Looming Market Top - Multi-month Decline on Horizon

Glenn Neely, founder of NEoWave Institute and top Elliott Wave analyst, believes the S&P 500 is forming an important top and is preparing for a multi-month decline.

Aliso Viejo, CA (PRWEB) January 22, 2010 -- NEoWave Institute's Glenn Neely, the architect of the NEoWave method of stock market forecasting, believes the S&P 500 is forming an important top and is preparing for a multi-month decline.

"Due to the substantial advance following March 2009's low, many investors and analysts believe the worst of the economic downturn has ended. However, based on NEoWave theory, the opposite appears to be underway," says Glenn Neely. "The relentless, almost illogical advance of the past 10 months is coming to an end. This pending top will be followed by a significant 3- to 6-month decline, retracing 60 to 90% of the 2009 rally." To confirm this analysis, Neely points out the cash S&P must break 1100 in the month of January.


Interview with Glenn Neely November, 2009

VXX

The investment seeks to replicate, net of expenses, the S&P 500 VIX Short-Term Futures Total Return Index. The index offers exposure to a daily rolling long position in the first and second month VIX futures contracts and reflects the implied volatility of the S&P 500 index at various points along the volatility forward curve. The index futures roll continuously throughout each month from the first month VIX futures contract into the second month VIX futures contract.

Market volatility generally rises on declines and falls on advances.  The VXX replicates the  pricing of VIX, which measures market volatility. Note how on the Weekly chart below, VXX fell throughout the market rise of 2009:


VXX Weekly


Here is a Daily VXX chart, with a Pending Buy Signal basis my VXX Daily Trend Model:


VXX Daily Trend Following Model

No options or leverage here, but the entire concept of the underlying index, VIX, is itself leverage enough.  The Weekly flip to LONG is about 10% higher.  Should it get taken out, watch out below.

A

Thursday, January 21, 2010

S&P follow-up

A quick look at the SPX Daily Trend Model as it finished trading today:


SPX Daily - Vortex Indicator

From a shorter-term view:


SPX 30 minute

Google is down hard after-hours.  Here is my GOOG Daily Trend Model (excludes today's after-hours trading):


GOOG Daily Trend Following Model

SPX Daily (mid-day Thursday)


SPX Daily - Vortex Indicator

Close, but no cigar


SPX Daily

The chart says it all, Trend Following Model (solid navy line), Trend Line up from March, 2009 lows, Vortex Indicator and Blue Wave Trend Indicator.  All are carrying the same message, SPX is close to a major Sell signal.  Just not there yet.


A

Wednesday, January 20, 2010

SPX Hourly Chart

Below is the SPX hourly chart as we approach the top of the first hour in Wednesday's early trading.  As I wrote in my email update this morning, "After several false alarms with this model in the past two weeks, will this be the flip that sticks?"


SPX Hourly, Pending Sell Signal


Tuesday, January 19, 2010

A four letter word begging with F


F Daily - flirting with a reversal


F Weekly


KMKCF - update


KMKCF Weekly
Weekly Model Reverses SHORT below 1.92

GNVC - update


GNVC Daily
Reverses Short on drop below 1.60

TGB - two looks, one resolution

TGB was written up one year ago @ $1.00, using generic free online charts and traditional analysis.  

Currently its at $5.50.  Here is a look at TGB as a Trend Following Trade:


A

Saturday, January 16, 2010

Navigating what lies ahead

As you should know by now, on the first day of the new year I started a private email list by subscription only in which I am publishing the status of my Trend Following Trading Models.  The most important take away for my subscribers will be to handsomely (yes, that is a current photo of me to the right) profit from identifiable trends  by monitoring and following the S&P 500 and other tradable stocks and ETF's. 

Earlier I posted some postulations from Robert Prechter and Elliott Wave International relating to imminent changes in all markets taking place right now.  They are pounding the table much the same they were in the fall of 2007.

How would my SPX Trend Model have done back then?  Lets take a look:


SPX Weekly

The above chart is a graphical view of how my SPX Weekly Model handled market timing since the fall of 2007.  I've omitted the SPX prices and the level in which the Model will next go SHORT, in fairness to my subscribers. After all, that is what they are paying for.

In the table below, I've described the returns available from following the Weekly Model in terms of the unleveraged cash SPX index.


There are but four trades in a little over two years and an average gain per year of over 50%.  That's from what Prechter is describing as just Wave 1 Down and Wave 2 Up.  He is suggesting that there will be three more waves in the years ahead and that the next one, Wave 3 Down, will be unlike anything we have experienced in our lifetimes.  The entire sequence of five major waves, or trends, are great fodder for a Trend Following Trading Model like this one, as shown by the numbers in the table for just the first 2 of the 5 total waves.

If Prechter is right, this Model will catch it all.  If instead the market continues higher, well, the Model is already Long.  Trend following doesn't buy into Elliott Waves (directly) or any other form market analysis.  It takes its cues from one source only, underlying price action. 

Whatever lies ahead, I will be using my Models to navigate through it.  There is opportunity in crisis, just as there is in nirvana.  My Models are designed to cover whatever is coming, whichever direction and however dire, or calm, those financial winds blow.

Find something that works.

Then trade it.

A

The Biggest Downwave Ever?

Time to promote another free report from Elliott Wave International.  In case your are wondering, I promote about 1 out of every 25 reports they make available.  Why promote any?  Because there is certain content that is good, certain content that is mundane, some insipid and some outstanding.  It is this latter category, outstanding, that makes its way to my blog.

From EWI's description of this free report:
Prechter saw something on the horizon that the shortsighted mainstream market watchers did not, which brings me to the untold portion of this story …

In Prechter's eyes, the bear market is far from over, and what he expects to happen after the current rally ends is significantly important to how you position your portfolio now.

Prechter's firm, Elliott Wave International, is now offering for a limited time The Most Important Investment Report You'll Read in 2010. Inside, Prechter reveals his big-picture outlook for U.S. stocks and the U.S. economy. The eye-opening 13-page report, originally published for paying subscribers to his Elliott Wave Theorist, examines the government's unprecedented involvement in the financial markets and private enterprise. It reveals what's already taken place in candid detail then focuses you on what the government's measures will actually do for the U.S. financial markets and economy.


What's the big deal?  Why now?   Hasn't Prechter been touting this scenario for the past year?  From Friday's night EWI Short Term Update:

"Primary wave 3 (circle) down has started.....The implications of a complete Primary-degree bear market rally are major. It means that Primary wave 3 (circle) is starting, which should be the strongest down portion of the bear market to date, stronger than the decline that unfolded throughout 2008 and into the first few months of 2009."

Nothing in trading the financial markets is a certainty.  The entire trading paradigm is steeped in probabilities.  We try to control uncertainty by identifying and following trends.  Reading EWI's analysis is part of the identification process.  Their arguments are not facts, but they do lend some perspective to what very well may be happening in the days immediately ahead. A major change-in-trend from UP to DOWN in the financial markets.  My Trend Following Models will pick them up soon enough.  The SPX Hourly Model is already on a SELL.  The Daily Model is next and it on the verge of its switch from LONG to SHORT.  My Models don't deal with implications from these changes, but Prechter's excellent analysis does. 

Now, back the Wings game, then the Cardinals.  Let's not lose perspective on what's important.


A

Friday, January 15, 2010

SPX Hourly Chart


Terminal Wave Structure?


SPX Daily

Ominous


Main Entry: om·i·nous
Pronunciation: \ˈä-mə-nəs\
Function: adjective
Date: 1580
: being or exhibiting an omen : portentous; especially : foreboding or foreshadowing evil : inauspicious
— om·i·nous·ly adverb
— om·i·nous·ness noun
synonyms ominous, portentous, fateful mean having a menacing or threatening aspect. ominous implies having a menacing, alarming character foreshadowing evil or disaster


Last night I received the latest Elliott Wave Theorist.   In it, Prechter made a cogent case that the entire rally from last March was a Wave 2 counter-trend rally.  "Was," because he thinks its over, or is at least within 100 DJIA points from being over.  Wave 3 down, shown below on my chart, will take most of 2010-2011 and  that the center of this wave down will occur later in 2010 and will, "set records for financial panics."  He goes on to say that the panic felt at the time of 9/11 and/or October 2008 will pale in comparison to the financial panic at the center of Wave 3 Down.


My SPX Trend Model which tracts the market with Hourly, Daily and Weekly time periods is designed to identify and join in any such market crash and panic. If the market runs up instead, it grabs those points as well.

Find something that works.  Then prosper from it.


A

Thursday, January 14, 2010

GNVC

I intended this as a weekend post, but the stock is running, so here it goes:

On August 30, 2005 I first wrote up NNVC at 10c a share and have been pounding the table on this stock ever since.  Since then, I have highlighted other biotechnology companies with potential, as it is the one sector that I believe is immune from macroeconomic cycles.  We all want to live long and healthy lives and will pay almost any price to do so.

Today I am introducing GenVec  (GNVC) as another biotechnology opportunity in the making.  Here is my highest and best reason to be interested in this stock:


GNVC Weekly


But there are a lot charts that look like this one.  What is so special about GNVC?

(1) They are having late-stage (Phase III) success with their lead treatment (TNFerade) for pancreatic cancer, showing a 25% reduction in the risk of death compared to standard care;

(2) Their proprietary technology for vaccine and gene delivery has applications for mulitple therapeutic applications;

(3) GNVC's market cap is only about $180MM and with no debt, seems way undervalued for the therapeutic markets they are addressing;

(4) TNFerade has shown promise in multiple other tumor types including head and neck, esophageal, melanoma and ovarian cancers;

(5) GNVC's management has shown outstanding competence in managing finances, using grant revenue to subsidize much of its research and development to date. 

For a more comprehensive analysis of GenVec, here are a few links to more detailed (but just as positive) write-ups:

Merriman Curhan Ford, October 2009

CEO commenting on pending results, January 2010 

Roth Capital targeting $4 share price, January 2010 


I sent this out to my subscriber list earlier and since the stock seems to be running, wanted to get it out to everyone else.  My EW targets are $3 on the Daily chart and $4 on the Weekly chart. 

A

S&P Daily Trend Models


SPX Daily Trend Following Model 


The latest signal was on November 6th's close @ 1069.  Today the SPX is at 1145, for a gain of 76 points, or about 7.1%.


Below a chart of the SSO, the double-beta S&P ETF:


SSO Daily Trend Following Model


The SSO Model went LONG on November 5th's close at 34.90.  Today SSO is trading at 40.48, for a gain of 5.58 points, or about 16%.

A