Five o'clock in the mornin'
I'm all ready up and gone
Lord I am so tired
How long can this go on?
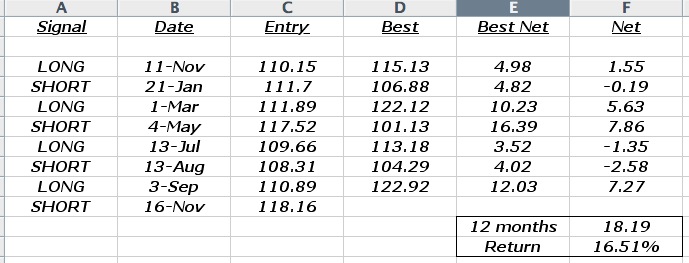
Here is a 12 month track record of the SPY Daily Trend Model. The table that follows contains entries (closing price of SPY day of signal) as well as "Best level" which marks the best price level achieved for each individual trend.
SPY Daily Trend Model
Past performance is not a guarantee of future results
There are many observations contained in these results. Striking is how successful the signals have been "intra-signal," that is, before slippage steals points leading into the next signal......But there's an App for that, especially for those trading highly leveraged options seeking to turn quick profits rather then waiting for reversing signals.
Consider also the effect of a 2X or 3X leveraged ETF applied to the net return compilations.
Maybe most important of all, no one signal had make or break power over the 12 months of results. Of the seven closed signals, three, almost half, were net losers.
This blog is for perspective, it is for discipline, it is for perseverance, its for going to work each day with a game plan, with strategies and with realistic, yet achievable, expectations.
A
Workin' in a coal mine Goin' down down down Workin' in a coal mine Whop! about to slip down
Eight is a core Fibonacci number (aren't they all?) as well as the number of hours in a typical work day in the colonies. These eight-hour trading models appear to work well in bridging the gap between shorter-term and intermediate term trend models.
DJIA 8 Hour AllanTrend Model
VXX 8-Hour AllanTrends Model
If these two new signals hold, it would appear that an Intermediate term reversal is at hand.
Press Release Source: NanoViricides, Inc. On Monday November 15, 2010, 7:00 am EST
WEST HAVEN, Conn.--(BUSINESS WIRE)--
NanoViricides, Inc. (OTC BB: NNVC.OB) (the "Company") reports that its optimized FluCide™ drug candidates achieved dramatic reduction in viral load within the lungs of animals infected with a lethal dose of H1N1 influenza virus.
The Company has previously announced that these optimized FluCide drug candidates demonstrated dramatically improved survival in this animal study. We now report that there was good correlation between viral load reduction and the length of survival.
The most effective FluCide candidate demonstrated a fifteen-fold (15X) greater viral load reduction as compared to Tamiflu(r) (Roche), and a thirty-fold (30X) greater viral load reduction as compared to untreated animals. Tamiflu demonstrated a viral load reduction of only twofold (2X) compared to the untreated animals in this high infection, lethality study. The viral load is a measure of the amount of infectious influenza virus in the lungs of infected animals. This profound decrease in viral load is consistent with the observed substantial increase in length of survival upon nanoviricide treatment. The Company previously reported that animals treated with this FluCide candidate survived for as long as 18.1 days on average, compared with only 7.8 days for Tamiflu treated animals. A survival length of 21 days would be considered indefinite survival in this animal model.
The studies were conducted by Dr. Krishna Menon, PhD, VMD, MRCS, at KARD Scientific, MA. One million virus particles of Influenza A Strain A/WS/33 (H1N1) were aspirated directly into the lungs of mice. A repeat infection was performed at 22 hrs. This influenza model was designed to be uniformly fatal in 100% of the infected, untreated animals within 5 days after infection. Treatment with both FluCide candidates and Tamiflu commenced 24 hours after the initial viral infection. Tamiflu was administered orally twice daily at 20mg/kg (i.e. 40mg/kg/day) while the nanoviricides were intravenous injections at 100mg/kg every 48 hrs.
“Treatment with the Nanoviricide compounds resulted in a profound reduction in viral load. Other overt parameters of virus infection were similarly decreased. In addition, survival time was significantly increased,” said Krishna Menon, PhD, President of KARD Scientific.
The nanoviricides have been well tolerated with no overt adverse effects observed even in animals treated for more than 2 weeks. The Company, therefore, believes that dosage of the nanoviricides can be further increased to achieve greater levels of effectiveness. Additional data related to various parameters including histology and cytokines are pending from this study. The Company plans to report on the same as the datasets are analyzed.
My private email list - subscription service will soon be going to a new website. The site will have the advantage of near real time signals and a forum to discuss these charts and models, including special request charts. I'll be there too. I've kept the price of this service the same almost since inception. The added value of a live web site may be worth a lot more. We are all here to make money......me too. Maintaining the service has cut into my time to trade. The difference has to be made up somewhere. If you can't make money with these trend models, in significant multiples of the subscription cost, maybe you shouldn't be trading.
Yes, this is a hard sell. But if I raise the cost of a subscription when the new site goes live (for new subscribers only, current subscribers are locked in to their current rates), it shouldn't and won't come as a surprise. I think this service is worth every penny of its cost.......and a whole lot more.
Here is yesterday's end-of-day commentary as it went out to subscribers:
Trading Notes
It was about this time in early November, 47 years ago, when our lives were so innocently headed for the single most devastating shock to our society in modern history. To be followed on an even grander scale just 38 years after that, September 11, 2001. So when I saw the market start to sell off this afternoon, in quiet, anonymous bidding, it occurred to me that this just might be how the next one starts. An innocuous late day sell off that we have been conditioned by now to ignore, a few 60 minute models flipping SHORT, again, something so meaningless lately we hardly ever report it. Then even quieter trading into a quiet close and no once even considers that it may be different this time.
My worlds were rocked in 1963 and again in 2001. One event shaped the first half of my life. The second event is shaping the rest of my life. Where-ever we are at any one time in this 4th dimensional continuum of being, it remains invisible to these third dimensional eyes. As it must be.
But there is a tether that brings it all together. The financial markets and how we as a society behave as one was described by Robert Precther in his book, "Socionomics." Just a few short weeks ago, Prechter wrote that we were engulfed in the greatest financial top of all time. Each day that it doesn't arrive, is just one more day that it is closer. So when I see an innocuous little sell-off creeping into a late and largely forgettable Tuesday afternoon, I stop for a moment, think back 9 and 47 years ago and then start paying a little more attention.
I can think of a half dozen fundamental explanations that are plausible and there are probably just as many that are beyond my understanding and/or knowledge.
What I do know is that on November 3, NNVC reversed LONG @ $1.08. I also know that if NNVC closes this week above $1.33 it's Weekly model will reverse LONG.
It's been about 10 months since beginning the trend following quest via private email subscriptions and occasional forays here on the public side. I am days away from shifting the entire kitnkabooodle over to my own domain with public and private portals. We are beta testing now, that's how close.
In the words of everybody's mayor, Ed Koch, "How am I doing?"
Let's start with the Gold and Silver Basket. Here are the current real time positions and performance of the most recent signals from the portfolio of gold and silver stocks and ETF's:
The only difference between this table and my subscriber table is that in the subscriber table there is a column which contains a reversal level at which the current position will reverse. The average return for all positions shown is +50.36% The Weekly version of the Gold and Silver Performance analysis shows and average return of +109.21%.
Turning to individual stocks and select ETF's, here again is the real time positions and performance table of the most recent signals, leaving out the reversal levels:
Here the average return for all positions is +19.06%, while the Weekly average performance return is +49.36%.
Finally, let's take a look at what I call the Major Market Trend Models: SPX, QQQQ and VXX. These models also include intraday positions, based on hourly and/or 240 minute time frames. Note the significance of the Daily models:
Simply adhering to the Daily Trend, not only in this table, but in all of the above tables, adds up to a nice edge in trading. Yes, I think we have something that works. Now let's trade it.
Past results are no guarantee of future performance.
I learned about the Law of TANSTAAFL from a psychology professor at the University of Michigan, circa 1971:
THE AIN'T NO SUCH THING AS A FREE LUNCH
The returns and results set out above come with some costs. First, you have to keep up, know where the price reversals are on every position you are in, or want to be in. Second, you need to have the conviction to pull the trigger, a much easier said then done undertaking. A few weeks of following these models work their magic usually takes care of that business.
Finally, everything here comes under the umbrella of a subscription to these trading models. This is what you give to me in exchange for these models, offering them, maintaining them, analyzing and tweaking them. Some extras get thrown in along the way, including some speculative stock gems that come my way as well as my own macro view of financial themes and especially how they can be exploited for outstanding gains, all in concert with the models.
As for the new site with all of its bells and whistles, near real time charts and models, a private forum to ask me questions and/or for subscribers to banter back and forth about what opportunities they see and are acting upon, the price of a subscription will remain the same, at least at first. But as we grow and participants in the forum increase, the price may also increase as the best way to maintain value for existing subscribers.
It's been a great ride so far, but we are about to enter warp drive.
The stock market is a marathon for longer term investors. The Buy & Hold crowd was popular in the late 20th Century before being wiped out in the 2000-2002 debacle on Wall Street. Perhaps no group better then these conservative investors can benefit more from the trend models. We can describe it as "Buy & Holding Long Term Trends." Lets take a look at few Weekly Trends that we follow on the private e-mail list:
I gave these three new names to my subscribers over the weekend. As I wrote at that time,
These three names are HIGHLY SPECULATIVE and depart from the usually conservative nature of our Trend Following methodology. It's possible that all three can be cut in half in week, a day, or an hour. Conversely, all three could soar, doubling or tripling, or even more in a week, a day, or an hour. HOW we make money here is no less important then MAKING MONEY. We've seen that the Trend Models work i.e. they make money, so we are allowed to take a flier, or two, or in this case three, every once in awhile.
Mega Uranium - MGA (Toronto Exchange) / MGAFF (Pink Sheets)
Pelangio Exploration - PX.V (Venture Exchange) / PGXPF (Pink Sheets)
Golden Predator - GPD.TO (Toronto Exchange) / GPRXF (Pink Sheets)
For what seems like an eternity, NNVC has been on a Daily Sell Signal. Things look to be changing today:
NNVC Daily Trend Model
If NNVC closes today above $1.08 it will generate its first Buy signal since August. Although not perfect, these Buys on NNVC have been very good, some leading to excellent returns.
On the fundamental side, here is a recent quote from Patrick Cox who writes, Breakthrough Technology Alert:
NanoViricides is on the precipice of a mammoth breakthrough — they hold what is likely the cure to all worldly viruses. In combination with that, NanoViricides holds a virtual license to profit through the FDA voucher system.
Best of all, the story hasn’t hit the mainstream media yet and your opportunity to join this transformational move is still here.
Incidentally, we know that small biotechs are particularly subject to irrational vacillations. It’s inevitable that this company will be bouncing in weeks and months to come. Right now, however, almost nobody knows what I’ve said in this report. If you plan to buy, be patient and pick up stock when prices are down.
If you jump in and bid the price of this small cap up too high, it will attract attention and the bargains could be gone for good. And please don’t settle for short-term gains of a few hundred percent. The long-run potential of this technology is far, far greater — and today’s opportunity truly is once in a lifetime.
Back when NNVC was under $0.50 I suggested that buying $10,000 worth of NNVC will be worth $1,000,000 by 2014. Development of the company's anti-viral platform in the past year is consistent with that forecast. If anything, I am way low as NNVC is getting ready to become front page news in every medical journal across the world. Again from Patrick Cox:
Next on the list is HIV. Back in 2008, spectacular results were announced for HIVCide in Israel. Based on the findings there, it was suggested that the company had attained a “functional cure.” This is due to the drug’s ability to decrease the amount of circulating virus and to suppress the virus exiting infected cells in which it was sequestered. HIVCide should allow an affected person to live an essentially normal life, as virus load is so low that the virus cannot be transmitted.
Want to put a price on the worth of an antiviral that conquers HIV?
NanoViricides, Inc. Reports Dramatically Extended Survival for FluCide™ Treated Animals in an Influenza Lethality Study
WEST HAVEN, Conn.--(BUSINESS WIRE)-- NanoViricides, Inc. (OTC BB: NNVC.OB) (the "Company") reported today that its FluCide™ drug candidates demonstrated dramatically improved survival in animals administered a lethal dose of influenza virus. Animals treated with all of the different influenza nanoviricide drug candidates survived for dramatically longer periods as compared to Tamiflu® treated animals.
Animals treated with the best of the optimized FluCide nanoviricide drug candidates survived greater than twice as long (18.1 days) as opposed to the animals treated with Tamiflu (only 7.8 days). In a previous study, the Company had reported that animals treated with the then best anti-influenza nanoviricides survived for as long as 13.9 days in the same animal model.
We are extremely happy with the substantially improved performance achieved in our optimization efforts,” said Randall Barton, PhD, Chief Scientific Officer of the Company, adding, “An increase in dosage is now likely to lead to total survival even in this completely lethal virus challenge model.”
“Our Influenza Program is progressing satisfactorily towards a pre-IND submission to the FDA in the near future,” said Eugene Seymour, MD, MPH, CEO of the Company.
Comment: It would be nice to see the stock pop, even double on this news, but whatever it does matters less then the significance of this development. Put away your trading hat for a moment, no, put it back on, and realize how this relates to NNVC's progress from a speculative, unheard of, shot in the dark biotechnology company to becoming one of the big boys on the block.
You can listen to a song a hundred times and never really hear it. Then a random fluke of fortune changes everything. On the 101st time it finds its way through and it resonates.
There is an inspired serendipity to my life. A theme that underlies all that I have done, every decision I have made and every path I have traveled. On Halloween a year ago, that instinct came alive and my wandering found a home.
The SPX_Weekly charts below have embedded upon them low and high volatility trend models. The volatility settings determine how sensitive the trend model is to price volatility. Higher volatility settings react to smaller moves in price to reverse trend, whereas the lower volatility settings require more price movement before reversing.
SPX Low Volatility Trend Model
SPX High Volatility Trend Model
Both trend models do a fine job of capturing major trends in the market. The trade off is better entries/exits from the higher settings, but better accuracy and less trading from the lower settings. In either case, the trend models add a tradable big picture advantage.
Bob Dylan is one of the most influential figures of the 20th century, musically and culturally. Dylan was included in the Time 100: The Most Important People of the Century where he was called "master poet, caustic social critic and intrepid, guiding spirit of the counterculture generation. Howard Sounes, biographer of Bob Dylan, placed him among the most exalted company when he said, "There are giant figures in art who are sublimely good—Mozart, Picasso, Frank Lloyd Wright, Shakespeare, Dickens. Dylan ranks alongside these artists."
I know two people who have seen Dylan in concert within the past few weeks. I saw him in Boston circa 1975 as part of his "Rolling Thunder Review" tour. At the beginning of the second set, just after intermission, Dylan stood behind a full length curtain with Joan Baez. As the curtain began to rise it revealed the duo singing, "Diamonds and Rust." Those chills resonate with me to this day as I recall that moment in my life...and his. Only a year away from 70 he is still touring, a living, breathing, singing, national treasure.
Shadows are falling and I’ve been here all day It’s too hot to sleep, time is running away Feel like my soul has turned into steel I’ve still got the scars that the sun didn’t heal There’s not even room enough to be anywhere It’s not dark yet, but it’s getting there.
This gold mania reminds me of the tech mania of the late 1990's that culminated in the great tech bubble top of 2000. As you may recall, that ended very badly. This time around, there are our trend models, so let's have a look at GLD:
GLD Hourly Trend Model
GLD Daily Trend Model
It's the Daily Model that is the key here. Sitting right on the trend line, either it finds support or knives through for a SELL Signal. The hourly model above is suggesting the latter.
GLL is the double short ETF for gold and as shown on the chart below, has just reversed LONG:
GLL Daily Trend Model
Bottom line, there are reasons to be cautious on gold right now, but unless and until the Daily GLD Model reverses SHORT, the intermediate uptrend is still intact.
The US Dollar is inversely correlated to most markets. Thus a rise in the dollar correlates to a drop in stocks, gold and anything else that is priced in dollars. Lets take a look at a chart of UUP, the bullish ETF for the dollar:
UUP Daily Trend Model
Five waves down, a break-out gap above the trend regression channel and an imminent LONG signal from the trend model. If UUP runs back to just the late August high at $24.22, it gains 7.00%. But, with minimal premium on UUP calls, a 7.00% rise will likely generate triple digit gains on in-the-money call options, subject only to the call's expiration month. I wouldn't look at any expiration closer then December, but next March might make the best cents (sorry) giving plenty of time for the dollar and UUP to turn up and run.
I just made a quick trip to Starbucks and realized what is wrong with our economy, in fact, in our society:
(1) Traffic lights. This is getting out of hand. I counted seven lights in the one mile trip to Starbucks. What do all of these sick jokes cost us? How about the anger and frustration, especially as a result of those self-absorbed, callous and cold-blooded drivers who trigger lights by radar coming out of some dinky side-street? How about the extra fuel used while idling at forever red lights? I'll bet we could be self-sufficient in oil just by cutting down 10% of traffic lights in our major cities. Or the wear and tear on brakes and the who knows what that black crap is being sent into the atmosphere every time our brakes are applied;
(2) Parking lot speed bumps. Why are they so high? They are more like walls then bumps, I have to speed up just to get the momentum to get over some of them;
(3) Photo-radar. George Orwell would have a field day with these big-brother intrusions into our privacy and well-being. How can a society be productive while we cower in fear every time we drive to a store or work, or to visit a sick relative in the hospital, or worse yet, a trip downtown to feed the hungry or to save the lives of children caught in house fires.
I imagine those UFO's are laughing there oval heads off as they hover and observe our species subverting our mobile technology and destroying what dignity we have left as a civilization.
Not much commentary is needed here. A 240 minute chart of the DJIA covering the past three months, the DJIA Trend Model, the current price of the index and the reversal level needed to reverse the trend SHORT.
Another Sunday and as usual, we depart from the markets for something warmer, more lyrical and usually very personal.
Here is our deal, I provide market insights the rest of the week, you read and listen to the words and music (in its entirety) found here on Sundays.
Deal?
If a song appears here a second time, its not a mistake, it is just that much more meaningful. If it appears without much commentary from me, it is even more meaningful.
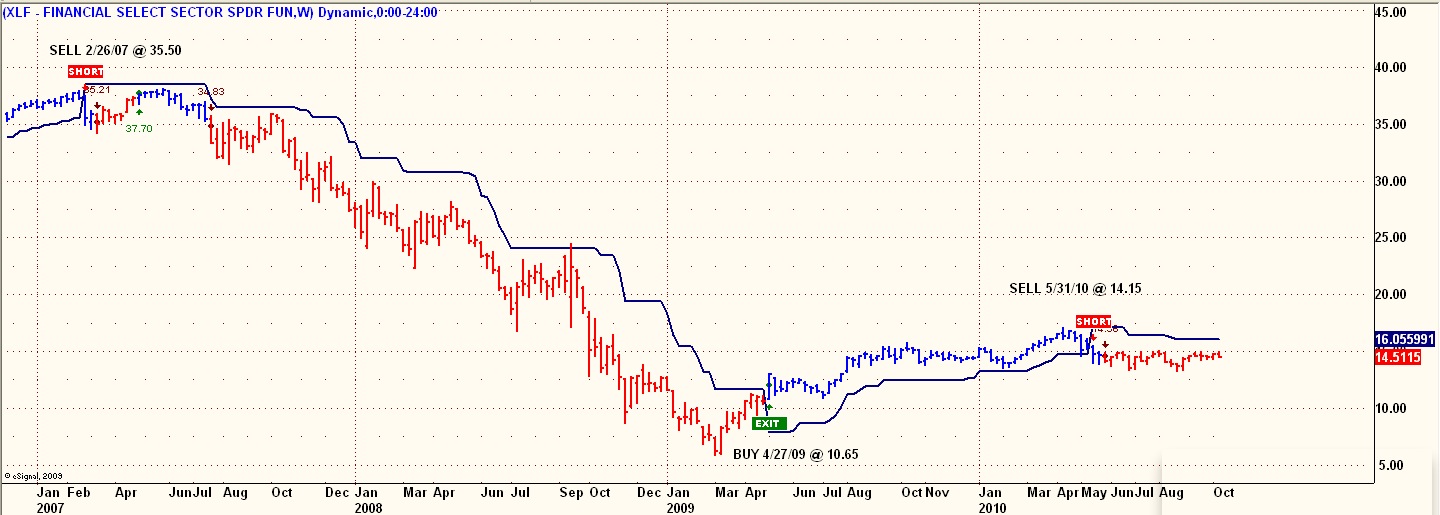
I just have to post this chart. The market last topped in October, 2007. But look here, the financials as represented by XLF, peaked in February, 2007:
XLF Weekly Trend Model
This year, XLF reversed SHORT in May and remains SHORT, although a little underwater as of today. But as shown on the above chart, the SHORT signal of early 2007 was also underwater for several weeks before the XLF came crashing down with a 71% decline.
Another omen that something wicked this way comes.
How important is the value of the dollar for stocks? For some insight into this relationship, here are two charts, UUP for the dollar and SPX for the stock market:
UUP Daily Trend Model
SPX Daily Trend Model
This looks like a step for step correlation to me. The implication is that no meaningful decline in the market should take place without a corresponding rise in the dollar.
Which leads me to the Detroit Red Wings. Las Vegas has them at 10-1 to win the Stanley Cup this season. I have them at 1-1. This discrepancy could end up being the best bet of all, regardless of the value of the dollar or level of the SPX.
In any case, three markers to keep an eye on in the coming months.
Below is a multi-year chart of the NNVC_Weekly Trend Model. Particularly illustrative of the power of this model are the LONG signals.
The first LONG was in October of 2005, which was triggered at $0.30 after which NNVC ran to a high of $3.75 in about six months. The next LONG was in February of 2008, which was triggered at $0.70 after which NNVC ran to a high of $1.78 in about 4 months. Finally a LONG was triggered in September of 2009 at $0.93 after which NNVC ran to a high of $2.64 in May of 2010.
The next LONG will be triggered, as of today, at $1.58. That number is dropping with every new week and NNVC is very close to a Daily LONG signal which does allow entry well before the Weekly trigger. As with any shorter term model, the Daily is more volatile then the Weekly and could reverse before mounting another drive up to the Weekly LONG trigger. Or, the stock could run right up to the Weekly trigger and never look back.
Who has the patience to trade these Weekly models? Those that like to win at this game. There is a lot of angst around at how long NNVC is taking to convince the world that they are the new standard, the new paradigm in anti-viral treatment of some of the worlds most virulent diseases. One thing is for sure, the trend models will get on board this stock well before the news that will propel the share price to all time new highs and then some.
I've been a stock trader for a long time, doing everything from day-trading, minute trading, swing trading and idiotic trading. But I have never gotten into weekly trading, even though some of the most successful hedge funds in the world generate outstanding performance from long term position trades based on weekly charts.
Below are some examples of good performing weekly trend models. In the spirit of past performance is not a guarantee of future results, along with Bob Prechter's thesis that something dramatic changed at the 2007 stock market highs, i.e. the beginning of a multi-year bear market that is now in its early stages, these particular charts using a weekly time frame and a low volatility setting illustrate that, yes, something has changed since 2007-8 and if it continues on its current path, weekly trend models should do very well in the years ahead.
Continuing on the 390 minutes theme, here are GLD and SLV 390 minute trend models:
My take away from these charts is that not only did the trend models give opportune entry signals, they also kept you in the two stocks for the entire extended run in share prices.
The most important time frame in my arsenal of trend models are the daily charts. They just seem to have the best balance between accuracy and frequency of trades. Since there are 390 minutes in each trading day, it might be illustrative, or even predictive to take a look at some 390 minute trend models on some bellwether stocks:
AAPL_390 Trend Model
BIDU_390 Trend Model
GS_390 Trend Model
PCLN_390 Trend Model
AMZN_390 Trend Model
GOOG_390 Trend Model
These last two, AMZN and GOOG have not yet reversed SHORT. This either means they are holding support in advance of a rip roaring bull market that will blow our socks off........or, they are about to flip SHORT and join the other key stocks in what could be quite a nasty decline.
It might help to let the right side of your brain (that's the intuitive part, if you have any of it left) handle this one.