Saturday, August 14, 2010

Our Tradable Edge

By now, it is no longer my tradable edge, it belongs to all who have been following my work this past year and especially those who have been gracious enough to subscribe to my private email list.  Along the way, the system has had its successes as well as a few stumbles and although nothing is perfect in trading, we seem to have found a method that provides favorable implied odds for trading the market, what I refer to as our tradable edge.

To the right of this page is my brief introductory essay, titled, "Why Are You Here?"  Notwithstanding the occasional human interest detours that chronicle my own version of, Eat Pray Love, we are here to make money.  So everything you read and see here, from my commentary to the charts to the occasional links to what I consider engaging ideas from others, is put up with a view toward making money in the stock market.  For most, that means to stop what you have been doing, end a series of bad decisions, flip-of-the coin guesses and failed strategies. In other words, if you want to start making money in this game, you really have to do things different, you need to find yourself a tradable edge and implement it in your trading.

The Trend Following Trading Model is our tradable edge.  It's premise is to identify the dominant trend of the market so we can align our trading accordingly.  Trading with the trend takes us out of the fog of stupidity in dealing with trading, but only if we surrender to the solutions provided by this simple,  objective, algorithm. Thus we have defined, quantified, embraced a new approach to our trading, one that will allow anyone to, "do something different" this time.   On to some charts.

Below is a two month chart of my VXX_240minute Trading Model.  On it are eight actual, real time trades of which six were nice winners and two were small losers.  Ergo the essence of trading such a system, not perfect, but good enough to provide a tradable edge.

VXX_240 Trend Model

The most recent trade is a LONG triggered at 90 minutes into trading on Wednesday, August 10, 2010.  That trade is up about 9% in less then three days, that is without margin or options, just buying the VXX and holding with the trend.  How far will VXX go?  Don't know and don't care.  But at the early 2009 market lows, VXX printed 120. 

Below is a longer-term VXX study using daily closes for the Trend Model.  Again, not prefect, but the winners outnumber the losers and more importantly, the winners are much bigger then the losers.  A tradable edge?  

VXX Daily Trend Model

The algorithm works across a diversified cross-section of stocks, ETF's and indexes and can be applied to any time frame. While past performance does not guarantee future results, for now, this trend following algorithm is performing its job, providing a tradable edge allowing us to do something different this time.  Which brings me to the market and a big picture overview.

The Market

Here is a snippet of my Weekend Update sent out earlier this morning to my private email list:
I really want these Trend Models to speak for themselves, but I can't help myself.  Here is what I think:  We are at the beginning of  huge decline in market capitalization of the US and global stock markets. That means lower stock prices, much, much lower prices in an extended bear market, maybe one for the history books.  It is a convenient view with all of our index Trend Models in SHORT mode. But more then that, it allows me the luxury of designing a strategy that will maximize returns from such a decline.
With this as my operative thesis on the big picture, how does it reconcile with trend following and the trading models?  Remember, we want to do something different this time, we want to simply identify a trend and jump on board, whichever direction that trend is going.  If I were a rampant bull on the stock market and our economy, I would still be short the market in here, as the Daily and Weekly Trend Models are compellingly SHORT (note, VXX trades inverse to market direction, so it's LONG mode is market SHORT mode.).

Below is a NASDAQ weekly chart covering about the past two years of price action.  I've puposely left off any Elliott Wave analysis, which by-the-way is direly bearish currently.  Just the trends:

NASDAQ Weekly Trend Model

Now here is the same chart with a couple of EW counts.  The first count, in squares, is based on an EW algorithm in my software program, Advanced GET.  The second count, in black, is my preferred count as well as the preferred count of Robert Prechter and Elliott Wave International.

NASDAQ Weekly Trend Model with Elliott Wave analysis

The implications of the two wave counts are for all intents and purposes the same.  An extended decline in stock prices that will take out the lows made in March, 2009.  (Remember, VXX printed 120 at those lows.)

This is how my market view reconciles with the Trend Following Trading Model.  It caught the massive down move from late 2007 into early 2009.  It then caught the rally that lasted into April, 2010.  It's too early to say how far this newest trend will go nor how long it will last.  But my whole point of this post today is to suggest that it doesn't matter.  If Prechter's analysis proves accurate, there will be huge profits generated by being short for the bulk of the decline.  The same holds true for the Advanced GET analysis. As I wrote to my subscribers earlier, if neither scenario unfolds, our Trend Models will let us know by reversing LONG.  

I started this private e-mail list (SUBSCRIBE button on the right, above my photo) in part because of this weekly NASDAQ chart.  The other indexes are pretty much the same.  I expect another leg down in the overall structure that began in late 2007.  It is beginning to look like that decline is in its nascent stages, right now, in August, 2010.  Why it is happening, where and when it will end is fodder for speculation, but for now, the dominant trend of the market looks to have turned down.  The market will do what is necessary leave most at the station.  Our simple algorithm and its trend line will almost certainly allow us to jump on board and go along for the ride.  That is our tradable edge.

A


Friday, August 13, 2010

GS - Sitting on a ledge


We've used GS as a market tell before.  I am surprised that it has held up as well as it has in the past few days.  A break below 149 would reverse GS's trend to down and would have bearish implications for financial stocks and the general market. 

Below, FAZ is suggesting its only a matter of time before GS makes its move lower:

NNVC - chart update

Look at the size of the most recent 240 minute bars.  You would think this company found the holy grail of anti-viral treatment.  Take note, something is up.

Thursday, August 12, 2010

NNVC

The NNVC Daily Trend Model has been SHORT since June 30 @ $1.80.  With NNVC up about 10% today, is it time to get back in?

NNVC_60 Trend Model


NNVC_240 Trend Model


NNVC_Daily Trend Model


The two key levels above are $1.12 (240_min) and $1.20 (Daily).  Notwithstanding general stock market conditions, this company is going forward in paradigm changing treatments of viral disease. It's easy to manipulate a stock like this, but not so easy to deny their place in watershed medical achievement.

A

Prechter on Bloomberg

Here is a link to a live interview of Robert Prechter on Bloomberg yesterday:

Robert Prechter, August 11, 2010

Prechter discusses current market conditions in the stock market and US Dollar.


A

Wednesday, August 11, 2010

Key Trend Models


Today has the potential to end the summer rally and lead-off an intermediate decline into autumn.  We have seen them rally the market back into the close too often to remove the word "potential" from this analysis. 

A couple of things though: 

First, the Russell 2000 (low volatility settings) is the weakest of all indexes and was never able to turn up, summer rally or not.  It should lead the markets lower should this downturn be confirmed.

Second, yesterday we saw the VXX_240 Trend Model reverse LONG.  Today, the VXX_Daily Trend Model is close to a BUY SIGNAL, but not there yet.  Should the DJIA SHORT SIGNAL be confirmed  at the close today and the Daily VXX reverse LONG, that would be a strong combination of signals to usher in the long-awaited intermediate market decline. 

A


Tuesday, August 10, 2010

VXX_240 Trend Model

VXX_240 Trend Model

Would you take this trade?  This reflects back to this weekend's post, The Tao of Trading. The LONG Pending signal still has not been confirmed, so as I am writing this there is about a 45 minute window in which this trend model is in "Pending" mode only.  The characteristic of this summer's market is to reverse initial moves like today's and recover to at least about break-even for the day.  This flies in the face of jumping into this signal early, if at all.  Such is the lot of the committed trader of this system.  One of these days the opening move will extend.  Who will be on board for that one?

A

Monday, August 09, 2010

Saturday, August 07, 2010

The Tao of Trading

I just sent out a Weekend Update to subscribers, titled, The Tao of Trading.
Tao 

1. In Taoism, the basic, eternal principle of the universe that transcends reality and is the source of being, non-being, and change.
2. In Confucianism, the right manner of human activity and virtuous conduct seen as stemming from universal criteria and ideals governing right, wrong, and other categories of existence.
What is the Tao of Trading?  It is the way.  Our indicators line up and we take a trade.  The outcome is not important.  If we are detached from the outcome, we can more easily do our job.  What is our job?  To implement strategies designed to generate profits.

Enter our Trend Models:

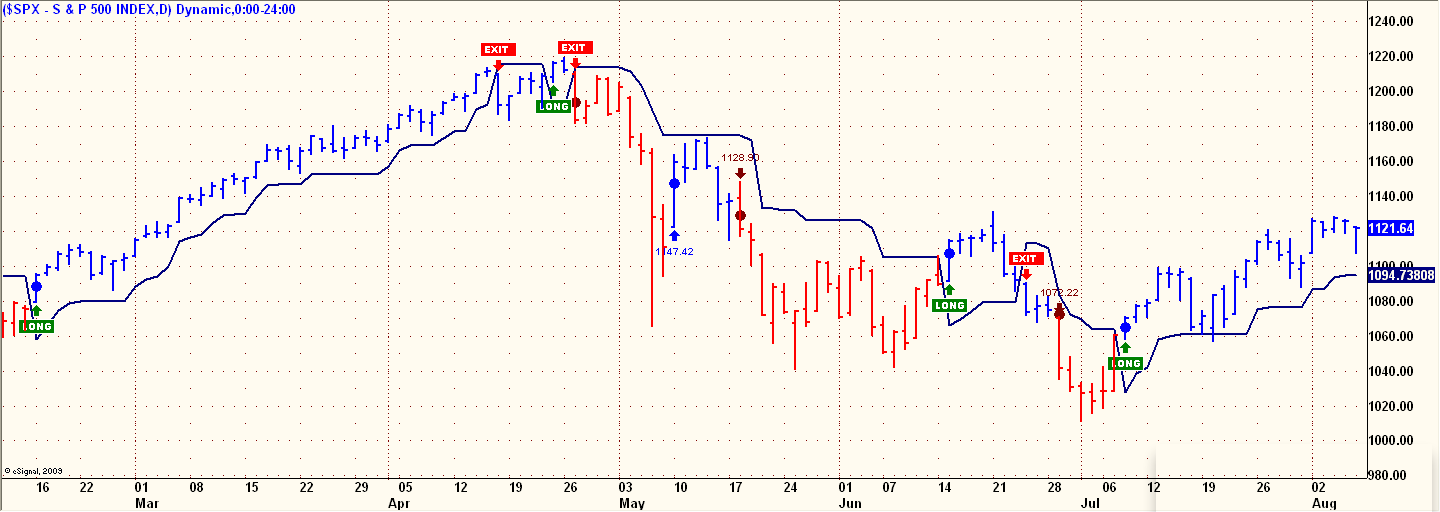
SPX_Daily Trend Model

We have seen this sucker before, it along with it's weekly counterpart, defines the dominant trend of the market. 

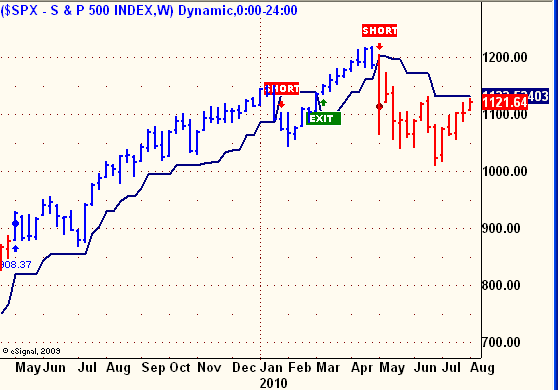
SPX Weekly Trend Model

Such has been the nature of our summer.  Our parenting unit, as represented by the above two SPX Trend Models, has been squabbling.  One is Yin, the other Yang.  Oh cruel fate......

Friday was a callous hoax.  The SPX_240 minute went SHORT, but the market refused to follow-through on the downside and recovered nicely into the close:

SPX_240 Trend Model

Yet we had to take this trade.  That is our way.  The 240 minute model is our heads-up and head-start on what is usually a pending Daily reversal.  But apparently not so in this case.  What did we do wrong?

Nothing.  

Such is the Tao of Trading.  If you are looking for perfection, marry me.  But as far as our trading strategies go, we are batting about .500, which means that half of our trades are like the one above, busted.  It's the other half that provides our sustenance.

In an ironic twist of karma, taking losses are part of the winning trading paradigm:
In order to take wins, you have to take trades;
In order to take trades, you have to take losses.
 
Was it Yogi Berra who said, "Half of psychology is mental"?  Well, at least half of trading is psychology and its never easy to take a losing trade in our accounts. But if successful trading was easy, everyone would be doing it.


The point that I made to my subscribers and which I am sharing here today is that successful implementation of a trading strategy isn't defined by taking profits alone, its defined by taking the trades that your system generates, all trades, regardless of the outcome.


The Tao of Trading.


A

Friday, August 06, 2010

VXX 240_min Trend Model

We've been watching this one all week:


Mid-seesion edit:

 This DJIA_10 minute chart is looking ominous, more so should today's lows get taken out:


A